Solar Dynamics Observatory - Argo view
Argos (or Argus Panoptes) was the 100-eyed giant in Greek mythology (wikipedia).
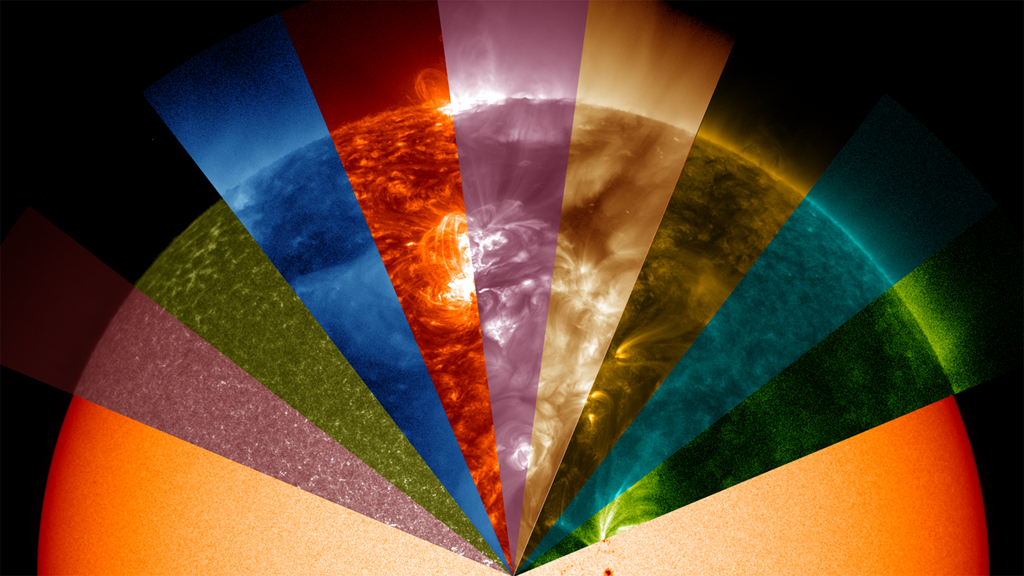
While the Solar Dynamics Observatory (SDO) has significantly less than 100 eyes, (see "SDO Jewelbox: The Many Eyes of SDO"), seeing connections in the solar atmosphere through the many filters of SDO presents a number of interesting challenges. This visualization experiment illustrates a mechanism for highlighting these connections.
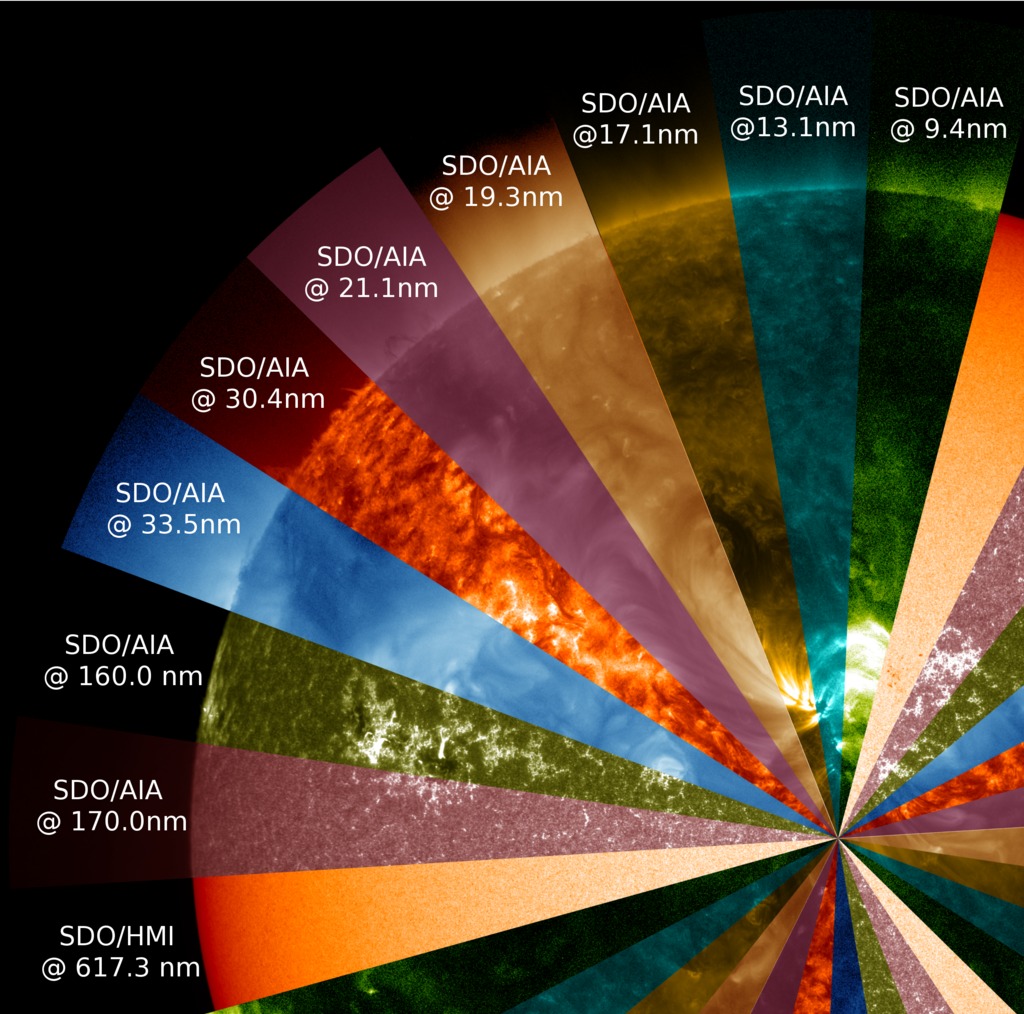
The wavelengths presented are: 617.3nm optical light from SDO/HMI. From SDO/AIA we have 170nm (pink), then 160nm (green), 33.5nm (blue), 30.4nm (orange), 21.1nm (violet), 19.3nm (bronze), 17.1nm (gold), 13.1nm (aqua) and 9.4nm (green).
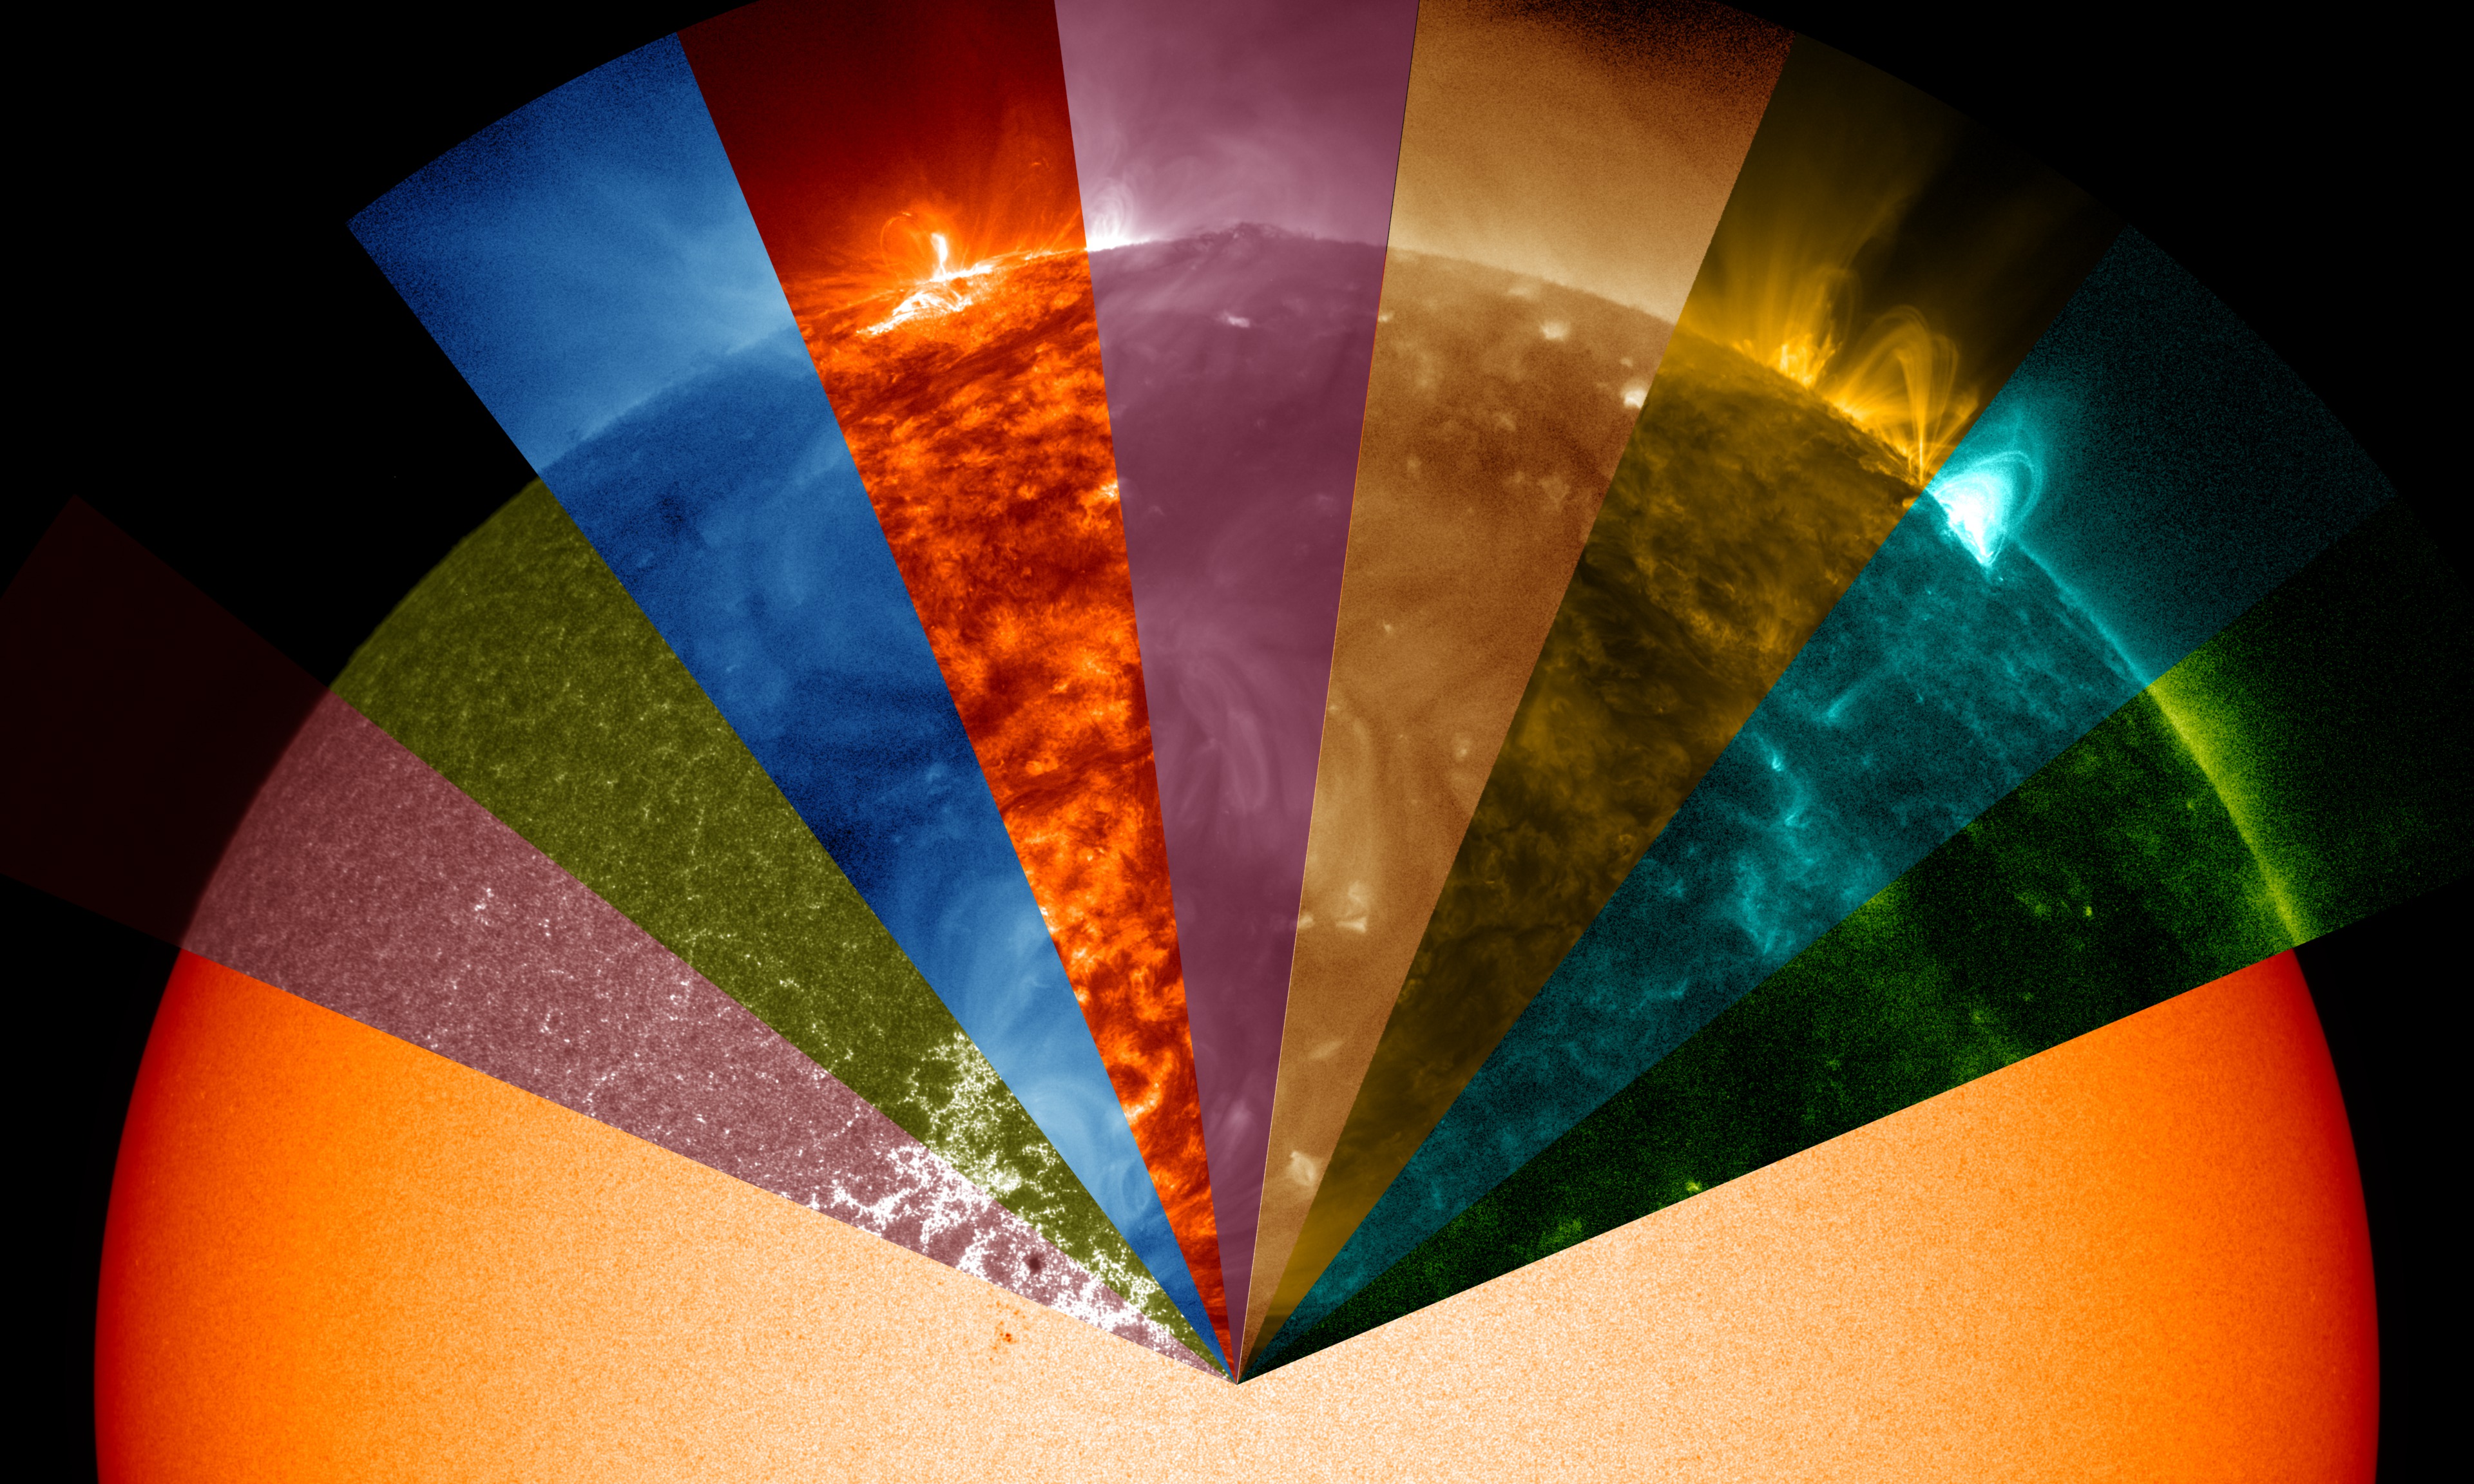
We've locked the camera to rotate the view of the Sun so each wedge-shaped wavelength filter passes over a region of the Sun. As the features pass from one wavelength to the next, we can see dramatic differences in solar structures that appear in different wavelengths.
- Filaments extending off the limb of the Sun which are bright in 30.4 nanometers, appear dark in many other wavelengths.
- Sunspots which appear dark in optical wavelengths, are festooned with glowing ribbons in ultraviolet wavelengths.
- Small flares, invisible in optical wavelengths, are bright ribbons in ultraviolet wavelengths.
- If we compare the visible light limb of the Sun with the 170 nanometer filter on the left, with the visible light limb and the 9.4 nanometer filter on the right, we see that the 'edge' is at different heights. This effect is due to the different amounts of absorption, and emission, of the solar atmosphere in ultraviolet light.
- In far ultraviolet light, the photosphere is dark since the black-body spectrum at a temperature of 5700 Kelvin emits very little light in this wavelength.
The movie opens with a full-disk view of the Sun in visible wavelengths. Then the filters are applied to small pie-shaped wedges of the Sun, starting with 170nm (pink), then 160nm (green), 33.5nm (blue), 30.4nm (orange), 21.1nm (violet), 19.3nm (bronze), 17.1nm (gold), 13.1nm (aqua) and 9.4nm (green). We let the set of filters sweep around the solar disk and then zoom and rotate the camera to rotate with the filters as the solar image is rotate underneath.
This video is also available on our YouTube channel.
Large frames of the same movie as above, rendered at 4104x2304 Hyperwall resolution.

A graphical key to the wavelengths of each part of the image. Note that this key shows which colors used in the graphic correspond to which wavelength of light - not that different wavelengths are mapped to different positions on the sun.
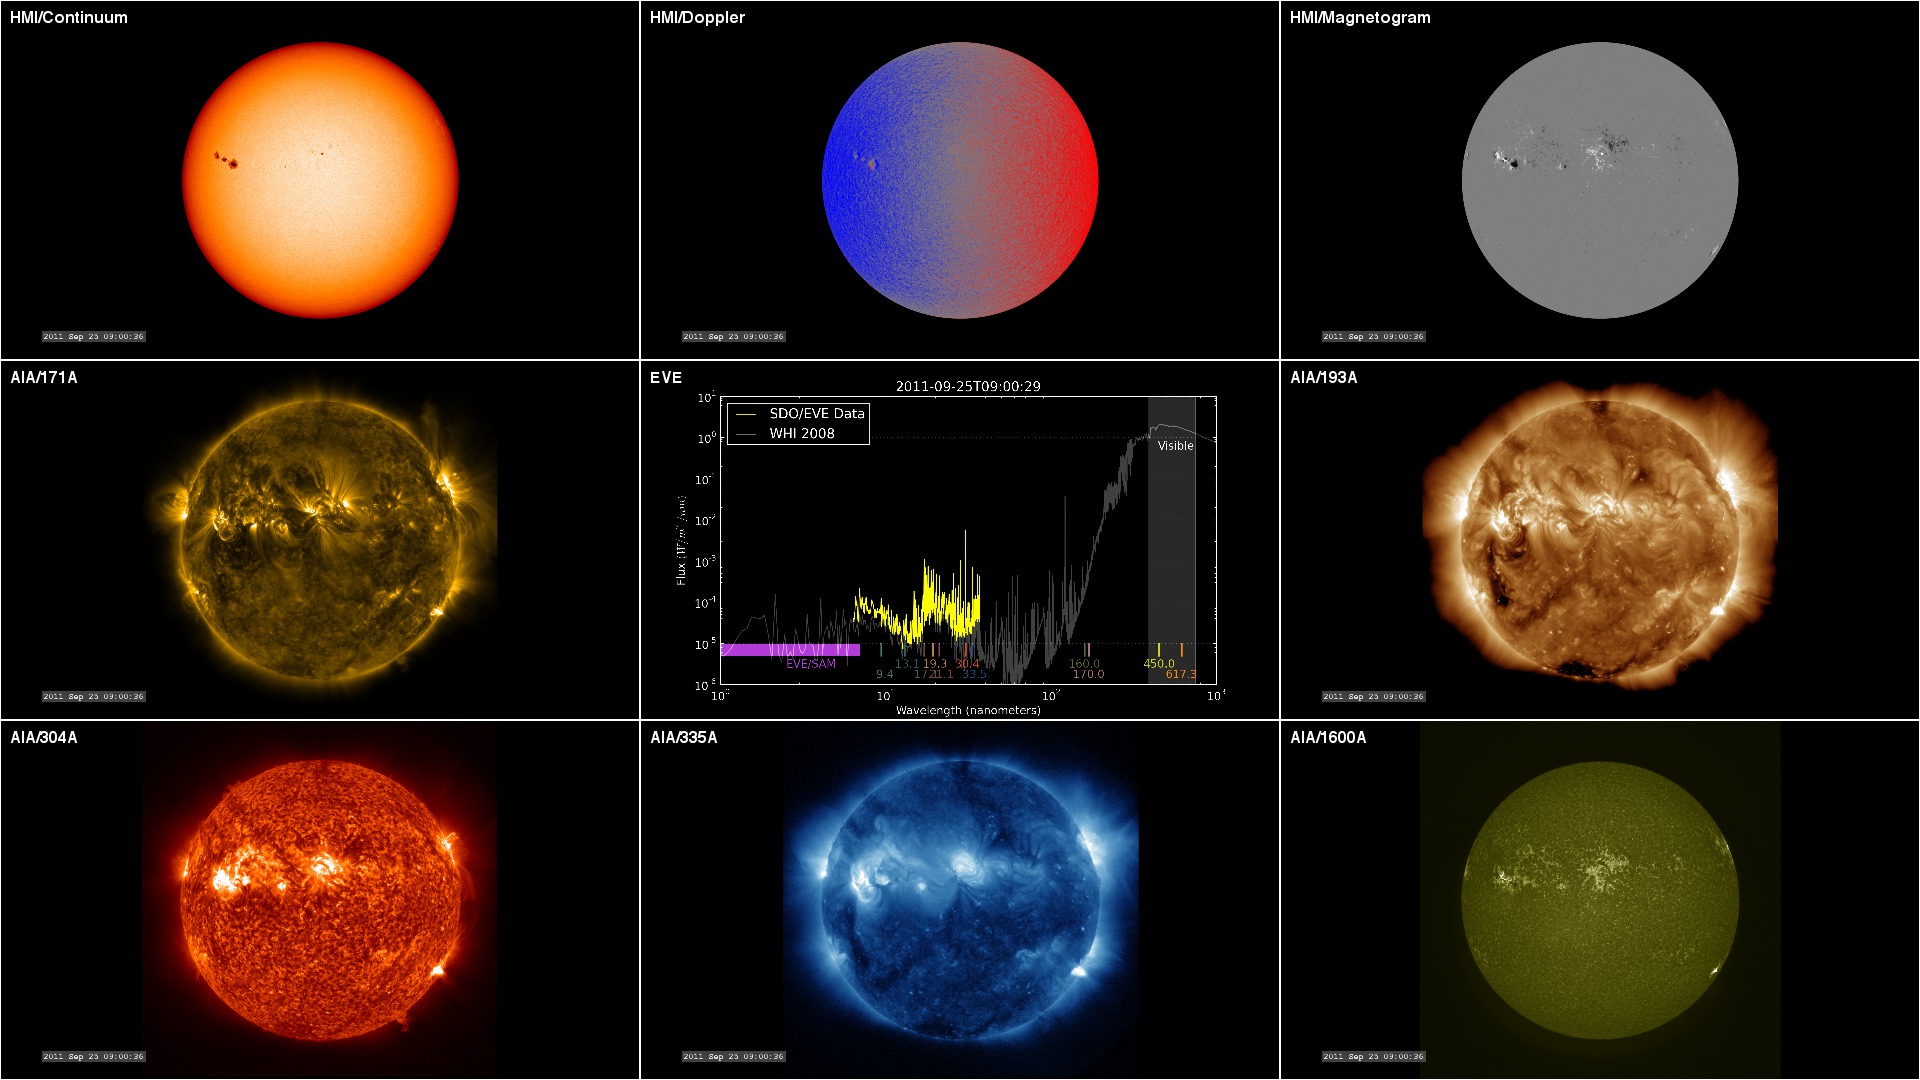
From animation 4009, a map identifying the wavelength locations of the various filters in the solar spectrum.
Credits
Please give credit for this item to:
NASA's Goddard Space Flight Center Scientific Visualization Studio
-
Animator
- Tom Bridgman (Global Science and Technology, Inc.)
-
Scientists
- William D. Pesnell (NASA/GSFC)
- Barbara Thompson (NASA/GSFC)
- C. Alex Young (NASA/GSFC)
Release date
This page was originally published on Tuesday, December 17, 2013.
This page was last updated on Tuesday, November 14, 2023 at 12:04 AM EST.
Missions
This visualization is related to the following missions:Series
This visualization can be found in the following series:Datasets used in this visualization
-
SDO Continuum (Continuum) [SDO: HMI]
ID: 674 -
AIA 304 (304 Filter) [SDO: AIA]
ID: 677This dataset can be found at: http://jsoc.stanford.edu/
See all pages that use this dataset -
AIA 211 (211 Filter) [SDO: AIA]
ID: 678This dataset can be found at: http://jsoc.stanford.edu/
See all pages that use this dataset -
AIA 193 (193 Filter) [SDO: AIA]
ID: 679This dataset can be found at: http://jsoc.stanford.edu/
See all pages that use this dataset -
AIA 171 (171 Filter) [SDO: AIA]
ID: 680This dataset can be found at: http://jsoc.stanford.edu/
See all pages that use this dataset -
AIA 1700 (1700 Filter) [SDO: AIA]
ID: 710This dataset can be found at: http://jsoc.stanford.edu/
See all pages that use this dataset -
AIA 131 (131 Filter) [SDO: AIA]
ID: 730This dataset can be found at: http://jsoc.stanford.edu/
See all pages that use this dataset -
AIA 335 (335 Filter) [SDO: AIA]
ID: 748This dataset can be found at: http://jsoc.stanford.edu/
See all pages that use this dataset -
AIA 94 (94 Filter) [SDO: AIA]
ID: 749This dataset can be found at: http://jsoc.stanford.edu/
See all pages that use this dataset -
AIA 1600 (1600 Filter) [SDO: AIA]
ID: 757This dataset can be found at: http://jsoc.stanford.edu/
See all pages that use this dataset
Note: While we identify the data sets used in these visualizations, we do not store any further details, nor the data sets themselves on our site.
Related
- ID: 11418
 Produced Video
 - ID: 4128
 Visualization
 - ID: 11385
 Produced Video
 - ID: 4008
 Visualization
Used as a Source In
- ID: 13859
![Music credits: “Swirling Blizzard” and “Endless Swirl” by Laurent Dury [SACEM] from Universal Production Music Watch this video on the NASA Goddard YouTube channel.Complete transcript available.](/vis/a010000/a013800/a013859/13859_SDOColors.00700_print.jpg) Produced Video
Produced Video