A newer version of this visualization is available.
2013 Daily Arctic Sea Ice from AMSR2: May - September 2013
The Japan Aerospace Exploration Agency (JAXA) provides many water-related products derived from data acquired by the Advanced Microwave Scanning Radiometer 2 (AMSR2) instrument aboard the Global Change Observation Mission 1st-Water "SHIZUKU" (GCOM-W1) satellite. Two JAXA datasets used in this animation are the 10-km daily sea ice concentration and the 10 km daily 89 GHz Brightness Temperature.
In 2013, the National Snow and Ice Data Center (NSIDC) determined the Arctic sea ice reached its annual minimum of 5.1 million square kilometers on September 13, 2013 using a 5-day trailing average. NASA scientists independently determined the Arctic sea ice reached its annual minimum extent of 5.217 million square kilometers on September 12 using a 5-day running average.
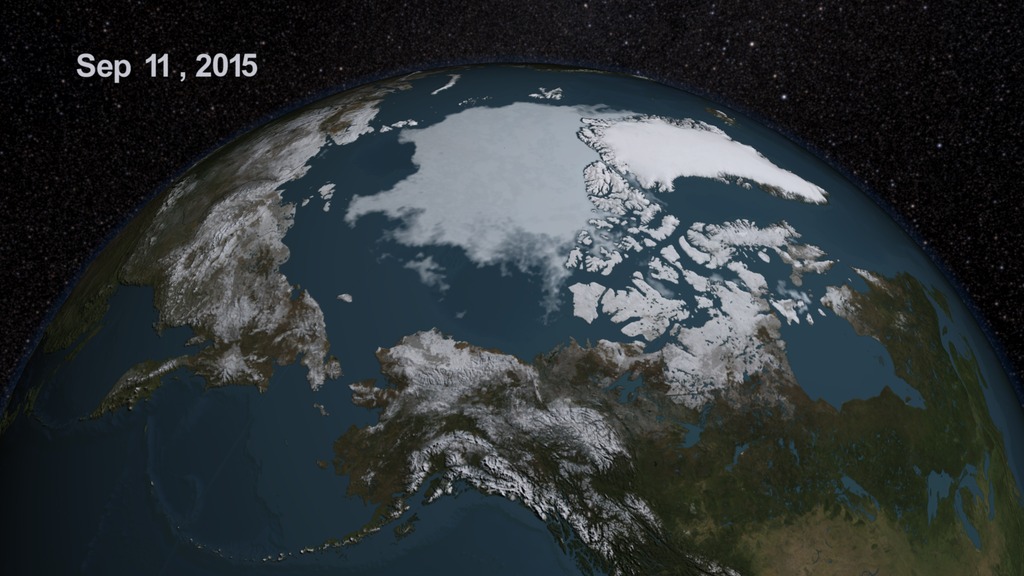
In this animation, the daily Arctic sea ice and seasonal land cover change progress through time, from May 16, 2013 through the minimum area of coverage for 2013. Two movies are provided: one stopping on September 12 and one that continues to September 13. Over the water, Arctic sea ice changes from day to day showing a running 3-day minimum sea ice concentration in the region where the concentration is greater than 15%. The blueish white colour of the sea ice is derived from a 3-day running minimum of the AMSR2 89 GHz brightness temperature. Over the land, monthly data from the seasonal Blue Marble Next Generation fades slowly from month to month.
The complete animation of the daily AMSR2 sea ice from May 16 through September 13, 2013.
The complete animation of the daily AMSR2 sea ice from May 16 through September 12, 2013.

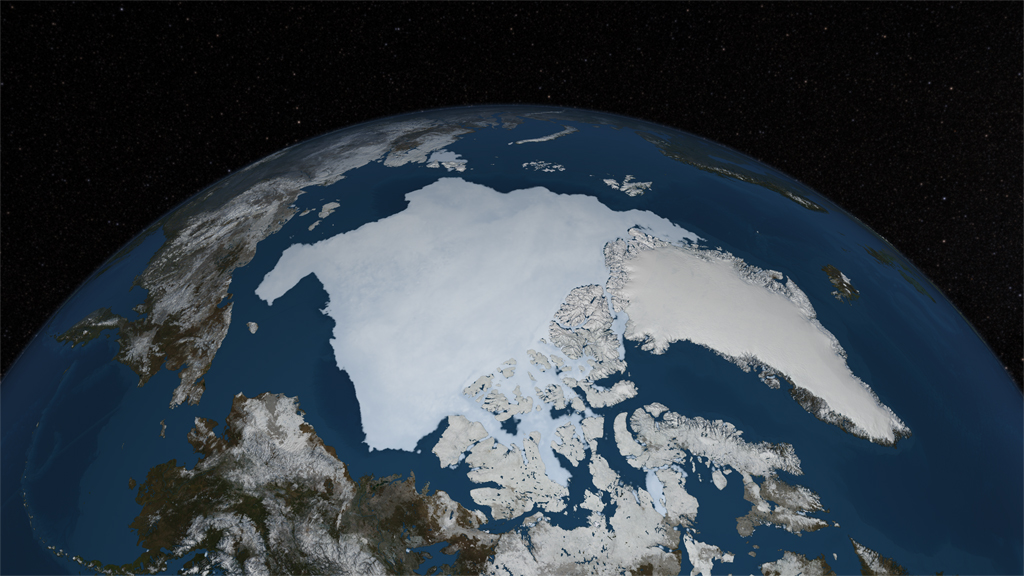
A still image of the Arctic sea ice on September 13th, 2013.
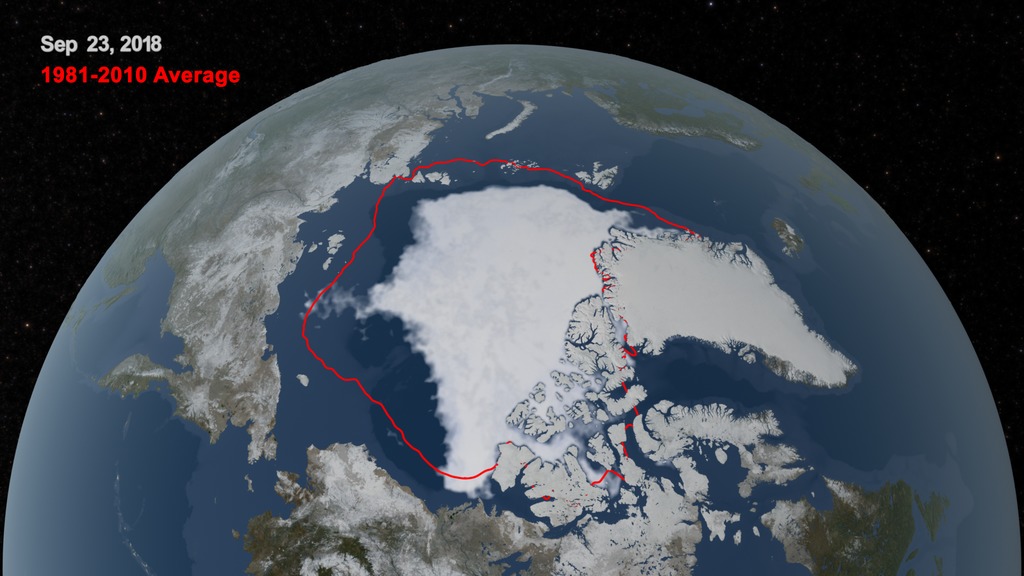
A still image of the Arctic sea ice on September 13, 2013 with a yellow line identifying the 30-year average extent.
A still image of the Arctic sea ice on September 12th, 2013.
A still image of the Arctic sea ice on September 12, 2013 with a yellow line identifying the 30-year average extent.
The Earth layer with transparency at a gamma of 1.0
The date layer with transparency at a gamma of 1.0
The star layer at a gamma of 1.0
For More Information
Credits
Please give credit for this item to:
NASA's Scientific Visualization Studio
-
Visualizer
- Cindy Starr (Global Science and Technology, Inc.)
-
Animator
- Alex Kekesi (Global Science and Technology, Inc.)
-
Producer
- Jefferson Beck (USRA)
-
Scientist
- Josefino Comiso (NASA/GSFC)
-
Project support
- Laurence Schuler (ADNET Systems, Inc.)
- Ian Jones (ADNET Systems, Inc.)
Release date
This page was originally published on Friday, September 20, 2013.
This page was last updated on Wednesday, May 3, 2023 at 1:51 PM EDT.
Missions
This visualization is related to the following missions:Datasets used in this visualization
-
BMNG (Blue Marble: Next Generation) [Terra and Aqua: MODIS]
ID: 508Credit: The Blue Marble data is courtesy of Reto Stockli (NASA/GSFC).
This dataset can be found at: http://earthobservatory.nasa.gov/Newsroom/BlueMarble/
See all pages that use this dataset -
10 km Daily Sea Ice Concentration [SHIZUKU (GCOM-W1): AMSR2]
ID: 795Credit: AMSR2 data courtesy of the Japan Aerospace Exploration Agency (JAXA).
See all pages that use this dataset -
10 km Daily 89 GHz Brightness Temperature [SHIZUKU (GCOM-W1): AMSR2]
ID: 796Credit: AMSR2 data courtesy of the Japan Aerospace Exploration Agency (JAXA).
See all pages that use this dataset
Note: While we identify the data sets used in these visualizations, we do not store any further details, nor the data sets themselves on our site.
Related
- ID: 11364
 Produced Video
Newer Versions
- ID: 4684
 Visualization
 - ID: 4355
 Visualization