IBEX Heliotail Observations
The IBEX (Interstellar Boundary EXplorer) continues to collect data on the flux of neutral atoms from the boundary of the solar wind with the interstellar medium.
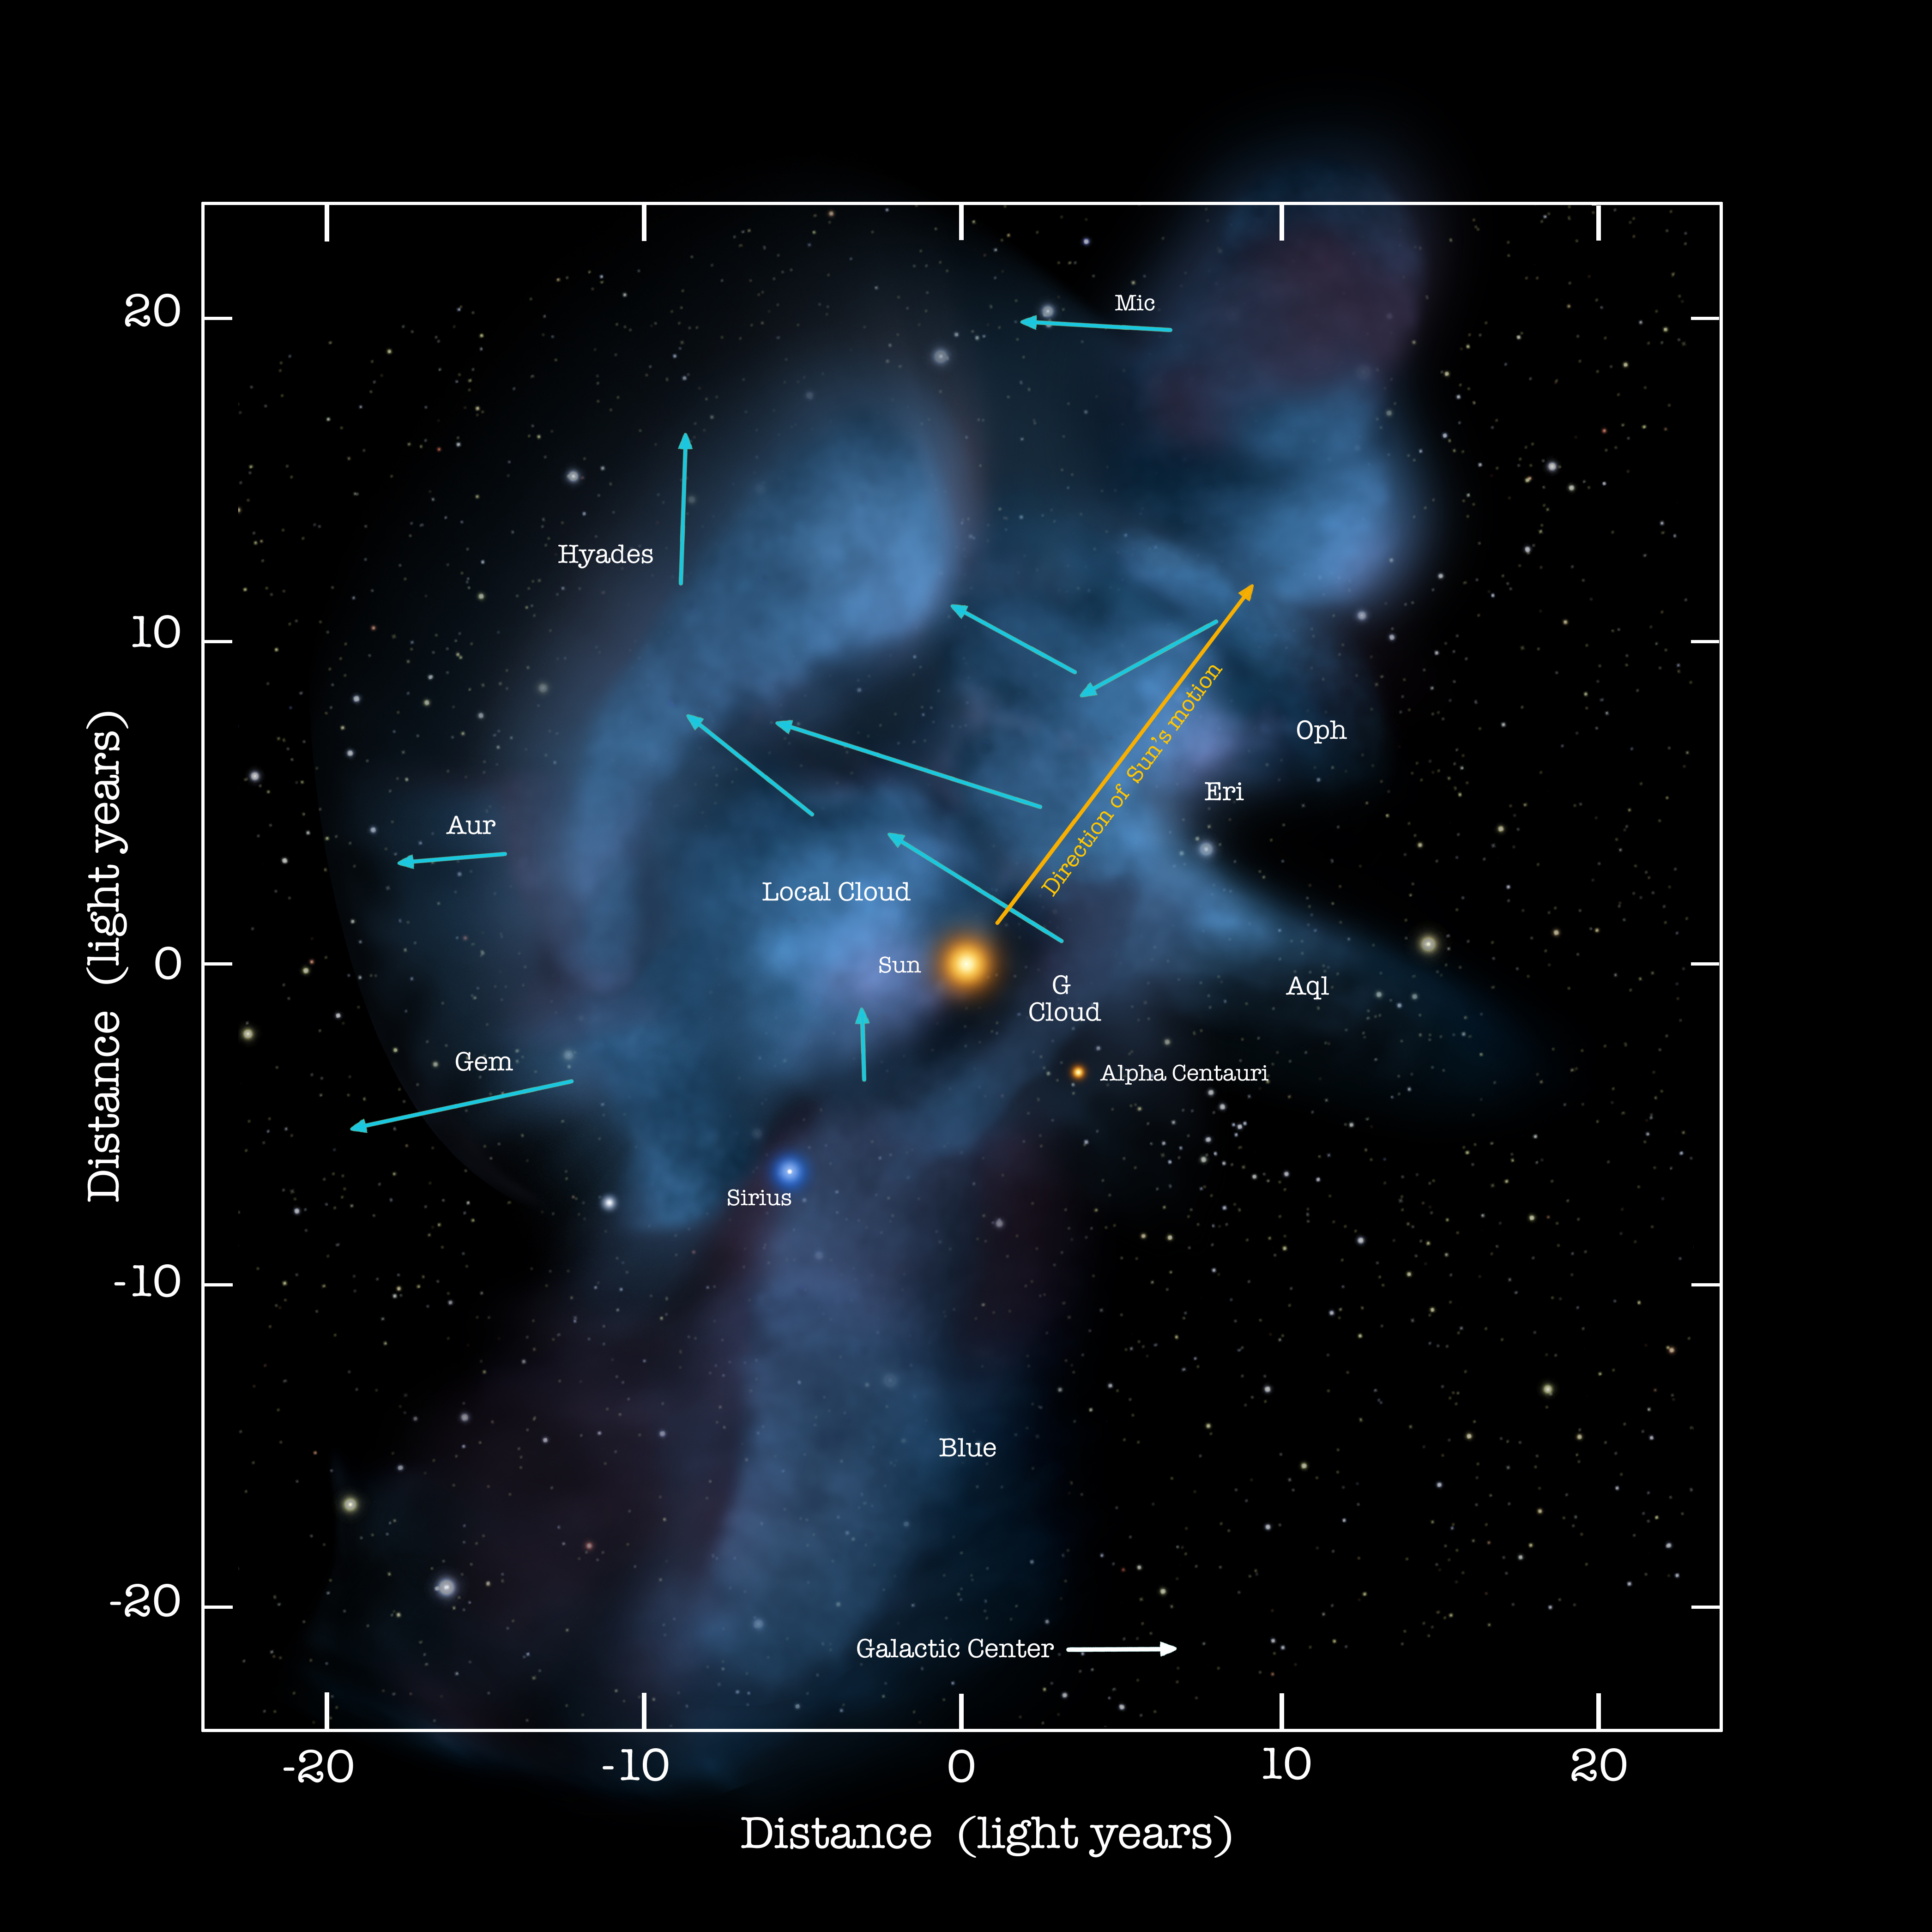
Starting with the IBEX satellite in orbit around the Earth, we zoom out to beyond the orbit of Neptune, illustrating the direction of the Sun relative to the local stars (red arrow) and relative to the local interstellar medium (violet arrow). These directions are different because the local interstellar medium (mostly gas and dust) move relative to the local stars.
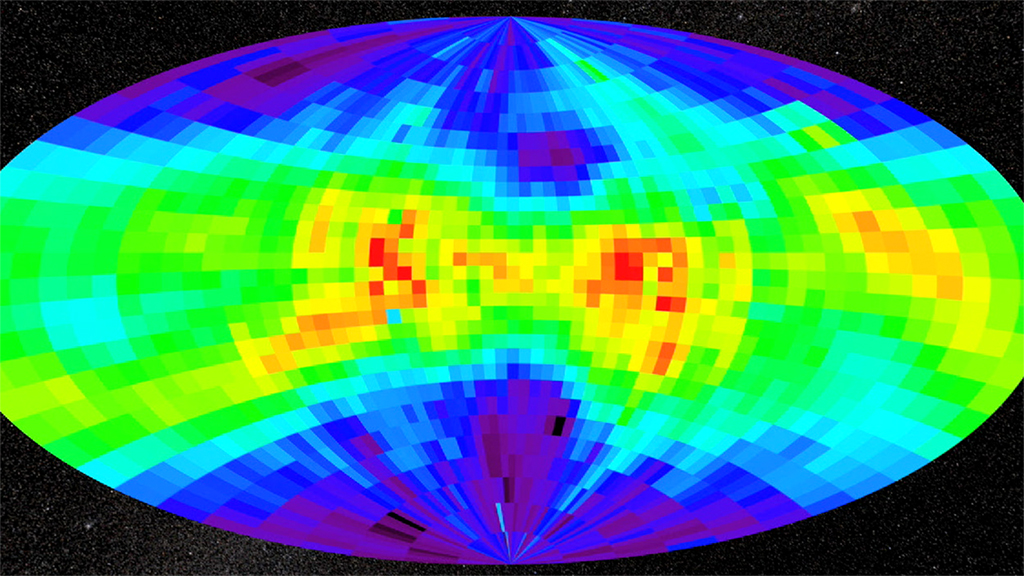
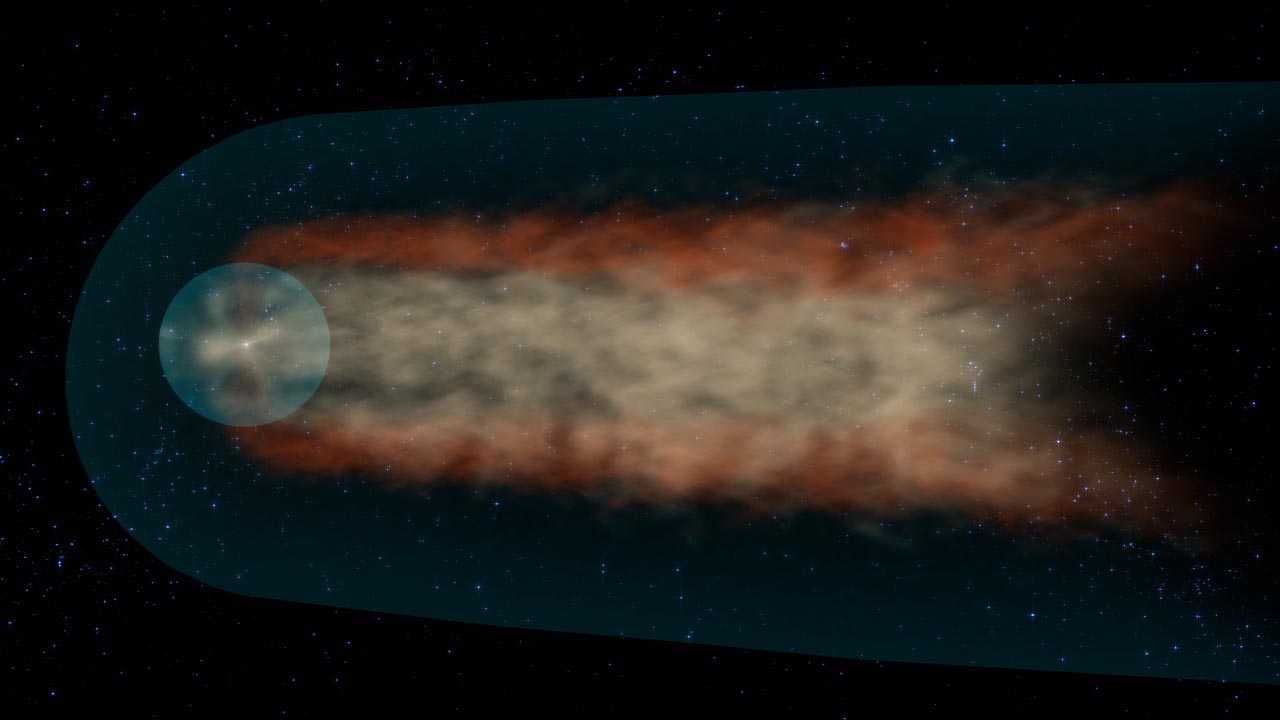
The boundaries of the termination shock (red ellipsoidal surface) and heliopause (green) created by the interaction of the solar wind with the interstellar medium is displayed. The camera rotates to a view 'nose on' with the heliopause, and a sphere is faded in representing the region where the neutral atoms detected by IBEX originate. The sphere around the Sun is 'unwrapped' to reproject the IBEX data into an approximately Aitoff projection.
Movie (with labels) of scope of measurements by IBEX.
Same as the movie above, but without the object labels.

Color bar for the IBEX map spectral index. The color represents the relative amounts of low-energy to high-energy neutral atoms. A lower spectral index means a higher proportion of high-energy to low-energy atoms.
Credits
Please give credit for this item to:
NASA's Goddard Space Flight Center Scientific Visualization Studio
-
Animator
- Tom Bridgman (Global Science and Technology, Inc.)
-
Producer
- Genna Duberstein (USRA)
-
Scientists
- Nathan Schwadron (University of New Hampshire)
- Dave McComas (SwRI)
Release date
This page was originally published on Wednesday, July 10, 2013.
This page was last updated on Wednesday, May 3, 2023 at 1:52 PM EDT.
Missions
This visualization is related to the following missions:Datasets used in this visualization
-
[IBEX]
ID: 207
Note: While we identify the data sets used in these visualizations, we do not store any further details, nor the data sets themselves on our site.
Related
- ID: 11321
 Produced Video
 - ID: 11301
 Produced Video
 - ID: 11306
 Produced Video