Supermoon 2013
On June 23, 2013, the Moon will be full at the same time that it is closest to Earth for the year. This coincidence is sometimes called a supermoon.
The Moon's orbit is slightly elliptical and therefore a little off-center relative to the Earth. Each month, the Moon passes through points in its orbit called perigee and apogee, the closest and farthest points from the Earth for that month. Some perigees are a little closer than others. The closest perigee for 2013 occurs on June 23 at around 11:18 Universal Time, when the Moon will be 356,991 kilometers (221,824 miles) away. As it happens, this is only a few minutes before the time of peak full Moon at 11:32 UT, when the Moon's ecliptic longitude differs from the Sun's by exactly 180 degrees.
How often does this happen? The period between perigees, called the anomalistic month, is 27.55 days. The time between full Moons, called the synodic month, is 29.53 days. These two periods sync up every 413 days, or 1.13 years. 15 anomalistic months are about as long as 14 synodic months. So that's how often the pattern repeats.
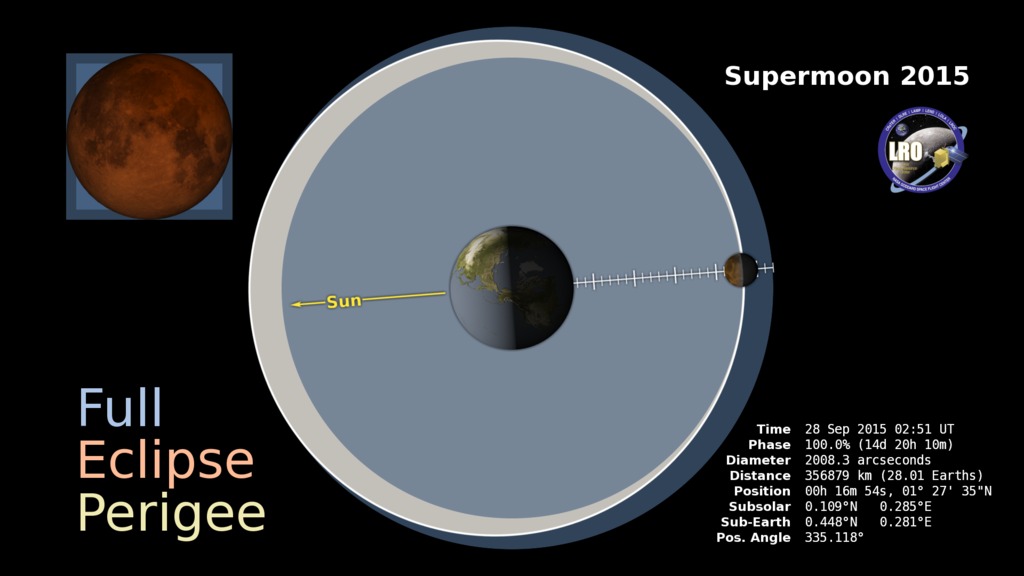
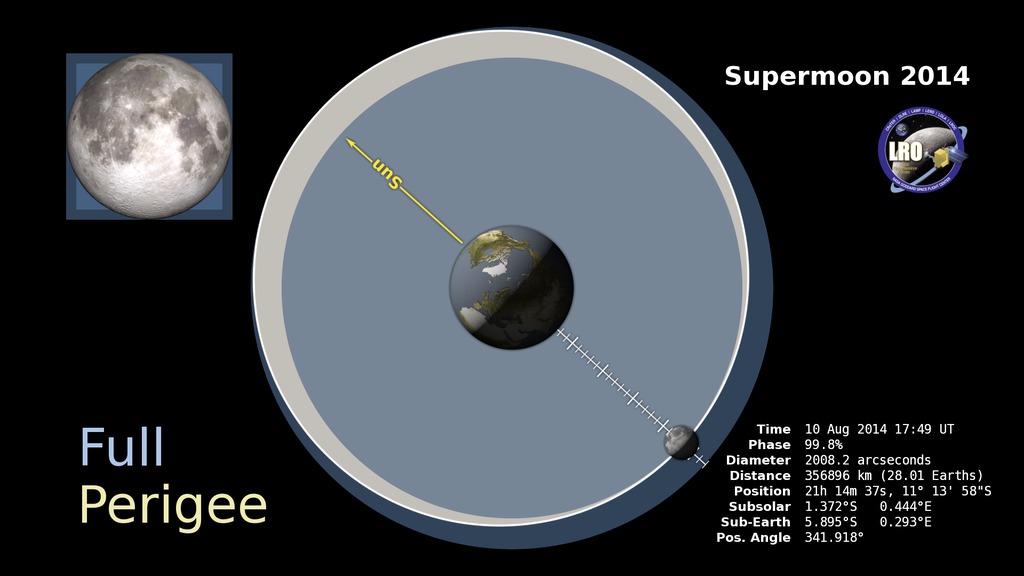
The animation begins in May, showing that perigee and full Moon miss each other by about a day. It then shows apogee on June 9, when the Moon is almost 32 Earth diameters away. It ends on June 23, the day of the supermoon, when the distance to the Moon is 28 Earth diameters. The Moon graphic in the upper left shows the change in the Moon's apparent size as it moves closer and farther in its orbit. (The relative sizes of the Earth and Moon in the main orbit graphic are exaggerated by a factor of 15 to make them more easily visible.)
By another coincidence, the supermoon occurs just two days after the northern summer solstice, when the Sun reaches its highest point in the northern hemisphere sky. The second animation shows the relationship between the Sun and the Earth at both the summer and winter solstice.
The geometry of the Moon's orbit in motion, from late May until the supermoon on June 23, 2013. Frame sequences with alpha channel are available for the separate elements of the animation.
The rotating Earth at the time of summer and winter solstice.
Credits
Please give credit for this item to:
NASA/Goddard Space Flight Center Scientific Visualization Studio
-
Animator
- Ernie Wright (USRA)
-
Producers
- Dan Gallagher (USRA)
- Michelle Handleman (USRA)
-
Scientist
- Noah Petro (NASA/GSFC)
Release date
This page was originally published on Friday, June 21, 2013.
This page was last updated on Wednesday, May 3, 2023 at 1:52 PM EDT.
Missions
This visualization is related to the following missions:Series
This visualization can be found in the following series:Datasets used in this visualization
-
[Clementine]
ID: 8 -
DEM (Digital Elevation Map) [LRO: LOLA]
ID: 653 -
DE421 (JPL DE421)
ID: 752Planetary ephemerides
This dataset can be found at: http://ssd.jpl.nasa.gov/?ephemerides#planets
See all pages that use this dataset
Note: While we identify the data sets used in these visualizations, we do not store any further details, nor the data sets themselves on our site.
Related
- ID: 4349
 Visualization
 - ID: 4193
 Visualization