CMEpalooza: The Complete Series
Mid-May 2013 marked a series of active solar events, the likes of which have not been seen since near the peak of solar cycle 23 in October-November of 2003 (see Looking Back at 2003s Spooky Halloween Solar Storms).
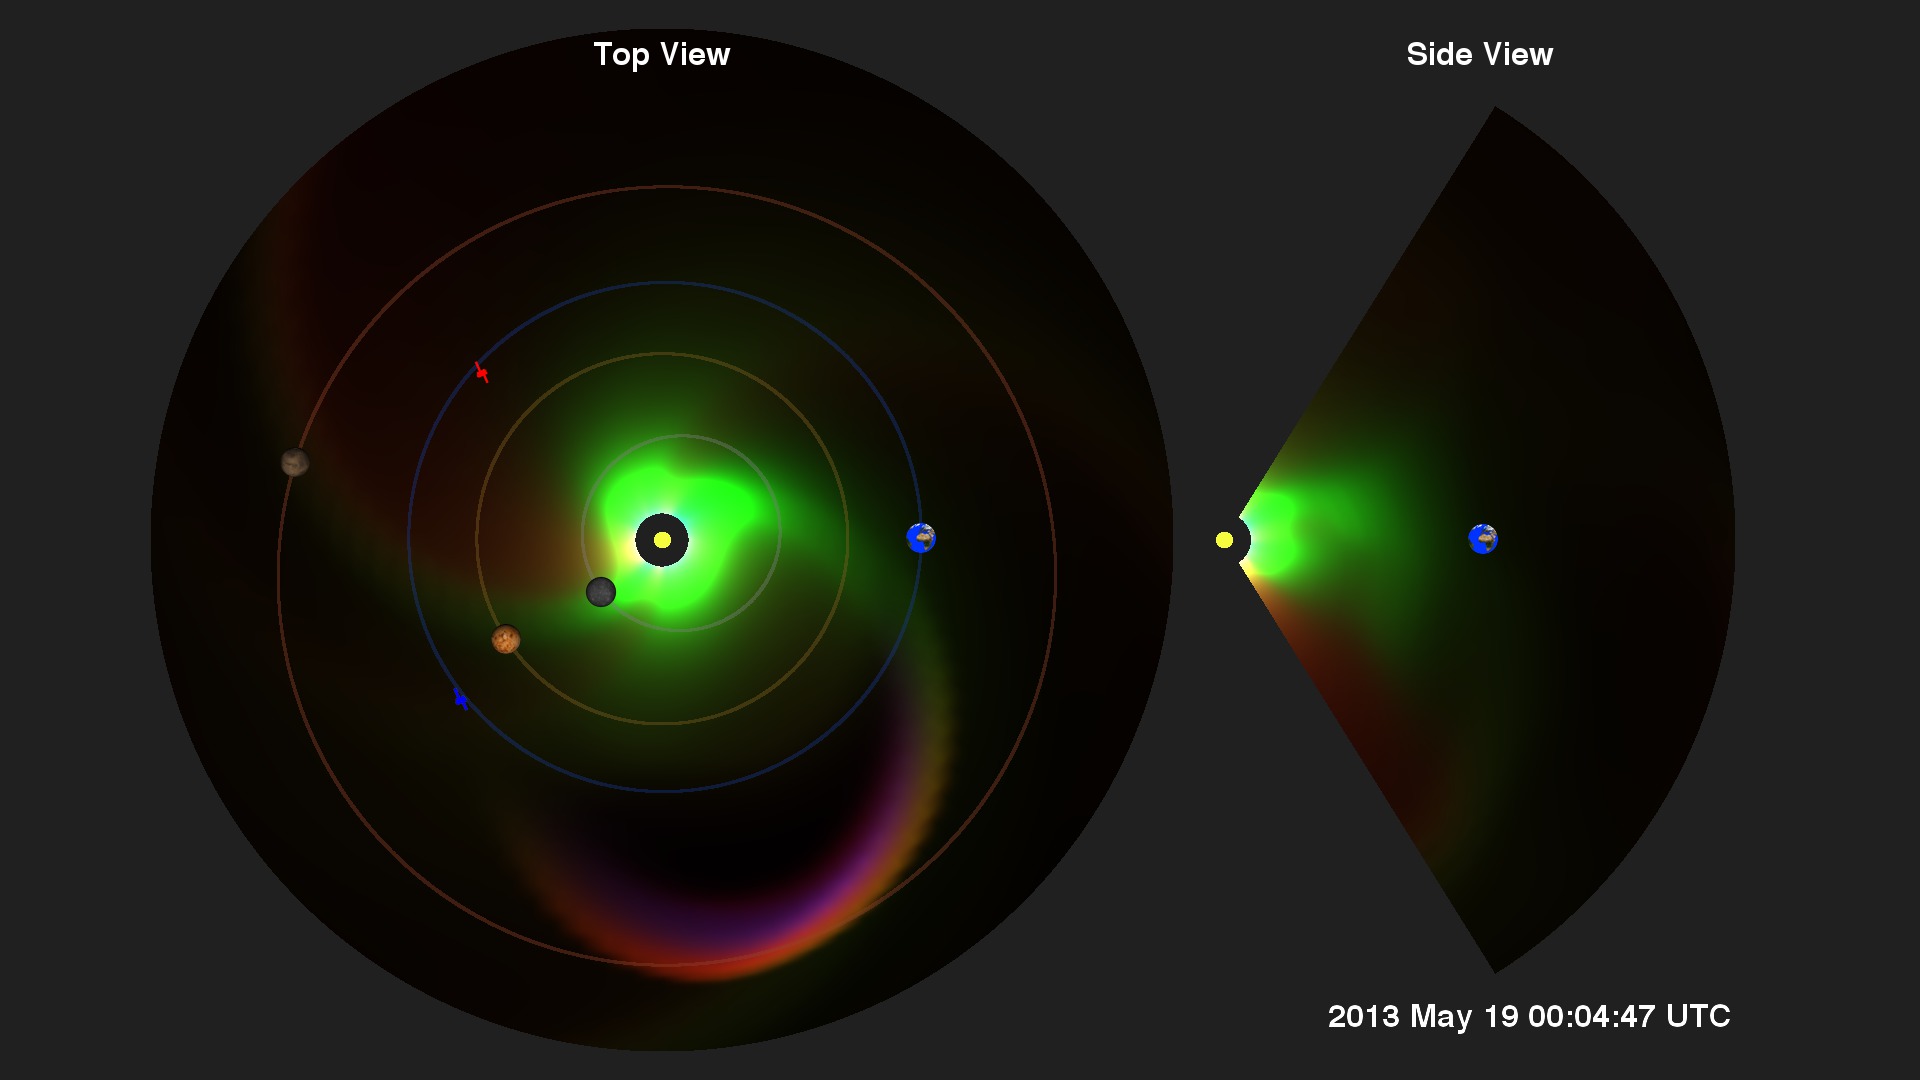
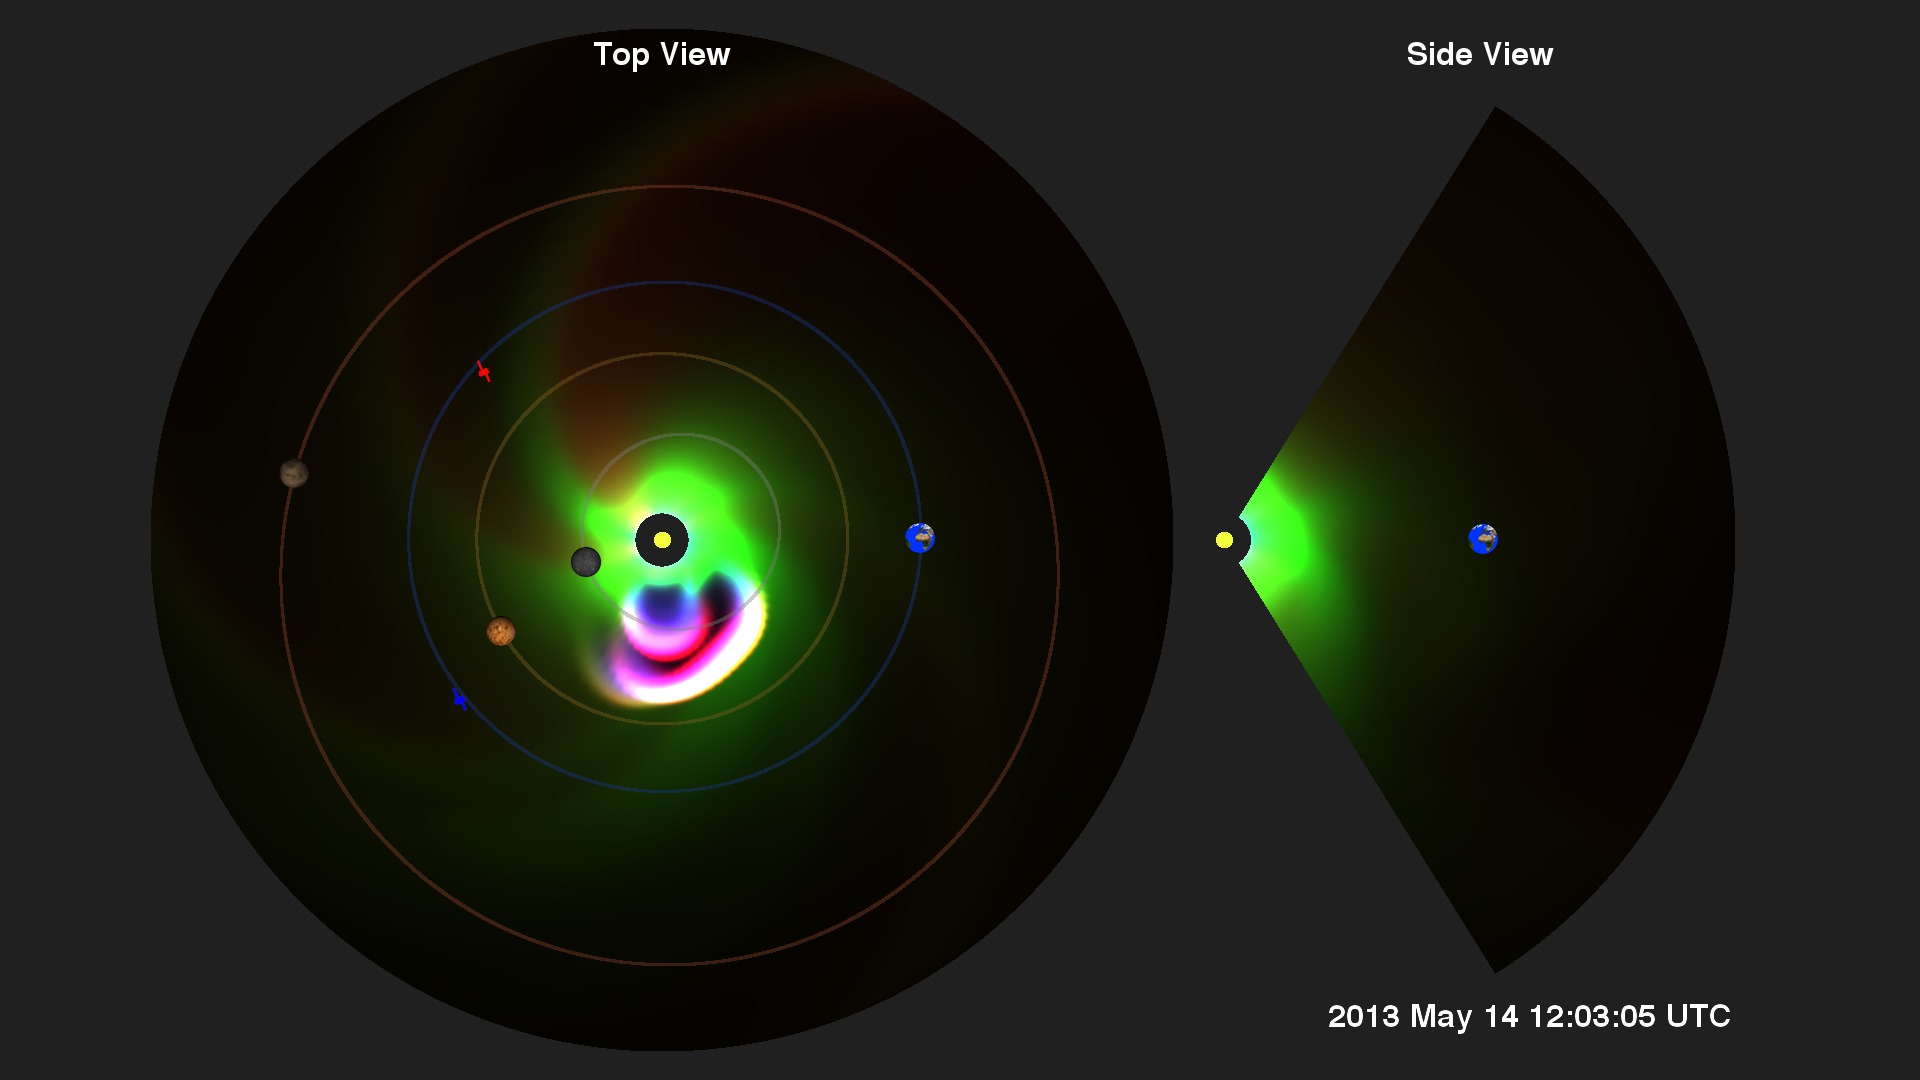
Five distinct coronal mass ejections, or CMEs, were launched from the sun from Active Regions AR 1748 starting May 13, 2013, through May 20, 2013. Some of the CMEs were associated with preceding M- and X-class flares. The CMEs were not a major threat to Earth technologies as most of them missed Earth, but they did impact various NASA satellites around the solar system. The last of the series of CMEs brushed by Earth.
Inner heliosphere view (to orbit of Mars) of launching of five coronal mass ejections (CMEs). Time samples of the model are three hours apart.
Outer heliosphere view (to orbit of Saturn) of coronal mass ejections. The timesteps of the model are six hours apart.

This color table represents how displaying each of the three variables as separate red, green, and blue color ramps combine to identify characteristics in the solar wind and CME.
The mass density in atomic mass units (AMUs) per cubic centimeter. 1 AMU/cc corresponds to 1 hydrogen ion or atom per cc.
Plasma temperture scale, in Kelvin.
Credits
Please give credit for this item to:
NASA's Goddard Space Flight Center Scientific Visualization Studio, the Space Weather Research Center (SWRC) and the Community-Coordinated Modeling Center (CCMC), Enlil and Dusan Odstrcil (GMU).
-
Animator
- Tom Bridgman (Global Science and Technology, Inc.)
-
Writers
- Tom Bridgman (Global Science and Technology, Inc.)
- Karen Fox (ADNET Systems, Inc.)
Release date
This page was originally published on Friday, June 14, 2013.
This page was last updated on Tuesday, November 14, 2023 at 12:04 AM EST.
Missions
This visualization is related to the following missions:Datasets used in this visualization
-
Enlil Heliospheric Model (Enlil Heliospheric Model)
ID: 685MHD solar wind simulation
See all pages that use this dataset -
DE421 (JPL DE421)
ID: 752Planetary ephemerides
This dataset can be found at: http://ssd.jpl.nasa.gov/?ephemerides#planets
See all pages that use this dataset
Note: While we identify the data sets used in these visualizations, we do not store any further details, nor the data sets themselves on our site.
Related
- ID: 4078
 Visualization
 - ID: 4079
 Visualization