High Altitude Imaging Wind and Rain Profiler(HIWRAP) onboard the Genesis and Rapid Intensification Processes(GRIP) Experiment monitors Eye Wall Development
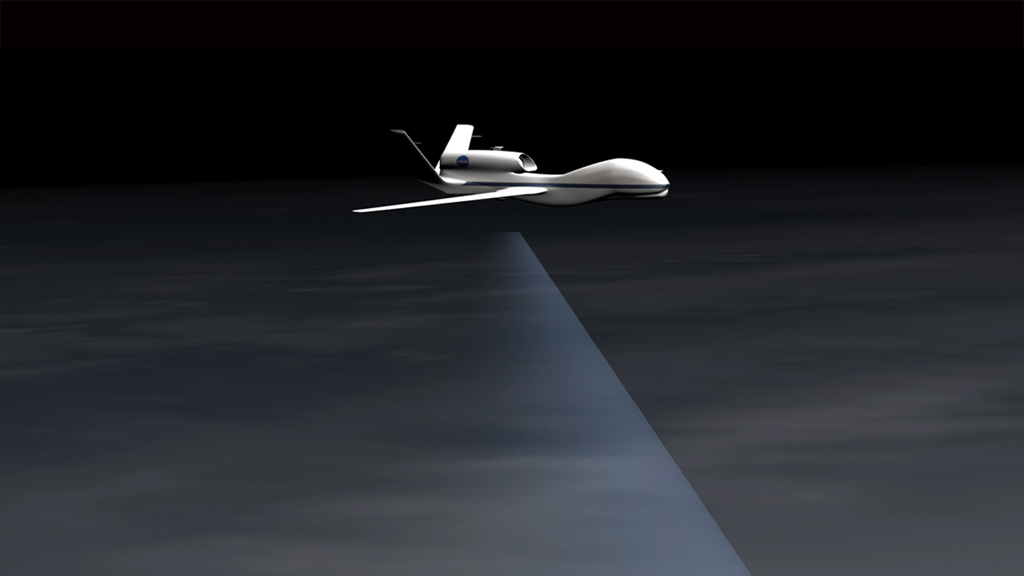
Wind measurements are crucial for understanding and forecasting tropical storms since they are closely tied to the overall dynamics of the storm. The dual-wavelength (Ku and Ka band) High-Altitude Imaging Wind and Rain Airborne Profiler (HIWRAP) flew for the first time on the Global Hawk Unmanned Aerial Vehicle (UAV) during the 2010 Genesis and Rapid Intensification Processes (GRIP).The HIWRAP is able to measure line-of-sight and ocean surface winds for a longer period of time than obtained by current satellites and lower-altitude instrumented aircraft. HIWRAP is conical scanning, and winds and reflectivity can be mapped within the swath below the Global Hawk. HIWRAP utilizes solid state transmitters along with a novel pulse compression scheme. This results in a system that is considerably more compact in size, requires less power, and ultimately costs significantly less than typical radars currently in use for clouds and precipitation observation. HIWRAP is able to image the winds through volume backscattering from clouds and precipitation, enabling it to measure the tropospheric winds above heavy rain at high levels. The first interesting case from the HIWRAP flights were the rapid intensification of Hurricane Karl on September 16 and 17, 2010. This visual will highlight the precipitation structure of this storms during their intensification as derived from the HIWRAP KU observations. Please note, the dimensions of the Global Hawk were exaggerated by a factor of 10 so the viewer could see the UAV. The Global Hawk actual dimensions are 44.4 ft (13.5 m) length by 116.2 ft. (35.4 m) wingspan by 15.2 ft (4.6 m) height. The movie starts as the Global Hawk flies over Hurricane Karl to reveal a Hot Tower. Hot towers are important to understanding hurricane intensification because they can carry hot moist air through the high layer of cirrus clouds above a hurricane. Hot towers are hard to study because they go so high and they do not last very long. In this movie, several of the paths have been placed in storm-centered coordinates and laid together to reveal the storm's hot towers and eyewall development. The structure of this storm is seen through reflectivity data where dbz is between 25 and 40.The HIWRAP data is colored based on the height. Red is 12 km, orange is 10 km, yellow is 7.5 km, green is 6 km, and blue is under 6 km.
More information on GRIP and other elements of NASA's Hurricane and Severe Storm Sentinel project visit http://www.nasa.gov/HS3.
The Global Hawk UAV flies over Hurricane Karl to reveal a hot tower. Red shows reflectivity that is 12 km from the surface, orange is 10 km, yellow is 7.5 km, green is 6 km, and blue is under 6 km.This movie shows the eyewall of the storm develop as the UAV monitors from above.

This image shows the eyewall develop. The eyewall convection persisted for over 11 hours and rotates cyclonically along the eyewall.
This image shows the 11 hours of data without the overlay labels. Passes are from the KU inner band at the following times:
September 16 from 18:53:10 through 19:19:18
September 16 from 19:38:29 through 19:57:40
September 16 from 20:09:56 through 20:55:23
September 17 from 05:37:55 through 06:00:45
September 17 from 06:09:33 through 06:29:01
For More Information
Credits
Please give credit for this item to:
NASA/Goddard Space Flight Center
Scientific Visualization Studio
-
Animators
- Lori Perkins (NASA/GSFC)
- Greg Shirah (NASA/GSFC)
- Horace Mitchell (NASA/GSFC)
-
Producer
- Jefferson Beck (USRA)
-
Scientists
- Gerald Heymsfield (NASA/GSFC)
- Stephen R. Guimond (University of Maryland)
- Scott Braun (NASA/GSFC)
- Scott Hanger
-
Project support
- Matthew McLinden (NASA/GSFC)
- Todd W. Powell (Boeing Satellite Systems, Inc.)
Release date
This page was originally published on Thursday, August 1, 2013.
This page was last updated on Tuesday, November 14, 2023 at 12:03 AM EST.
Series
This visualization can be found in the following series:Datasets used in this visualization
-
GRIP High Altitude Imaging Wind and Rain Airborne Profiler (HIWRAP) [Global Hawk UAV: HIWRAP]
ID: 772
Note: While we identify the data sets used in these visualizations, we do not store any further details, nor the data sets themselves on our site.
Related
- ID: 11367
 Produced Video
 - ID: 11039
 Produced Video
Used as a Source In
- ID: 12195
![Music credit: 'Cellular Signals' by Laurent Levesque [SACEM] from Killer TracksComplete transcript available.Watch this video on the NASA Goddard YouTube channel.](/vis/a010000/a012100/a012195/LARGE_MP4-12195_EPOCH_Hurricanes2_large.00151_print.jpg) Produced Video
Produced Video