National Climate Assessment: 21st Century Temperature Scenarios
The National Climate Assessment (NCA) is a central component of the U.S. Global Change Research Program (USGCRP). Every four years, the NCA is required to produce a report for Congress that integrates, evaluates, and interprets the findings of the USGCRP; analyzes the effects of global change on the natural environment, agriculture, energy production and use, land and water resources, transportation, human health and welfare, human social systems, and biological diversity; and analyzes current trends in global change, both human-induced and natural, and projects major trends for the subsequent 25 to 100 years. A draft of the Third National Climate Assessment report is available on the Federal Advisory Committee website. The final report is slated to be released in 2014.
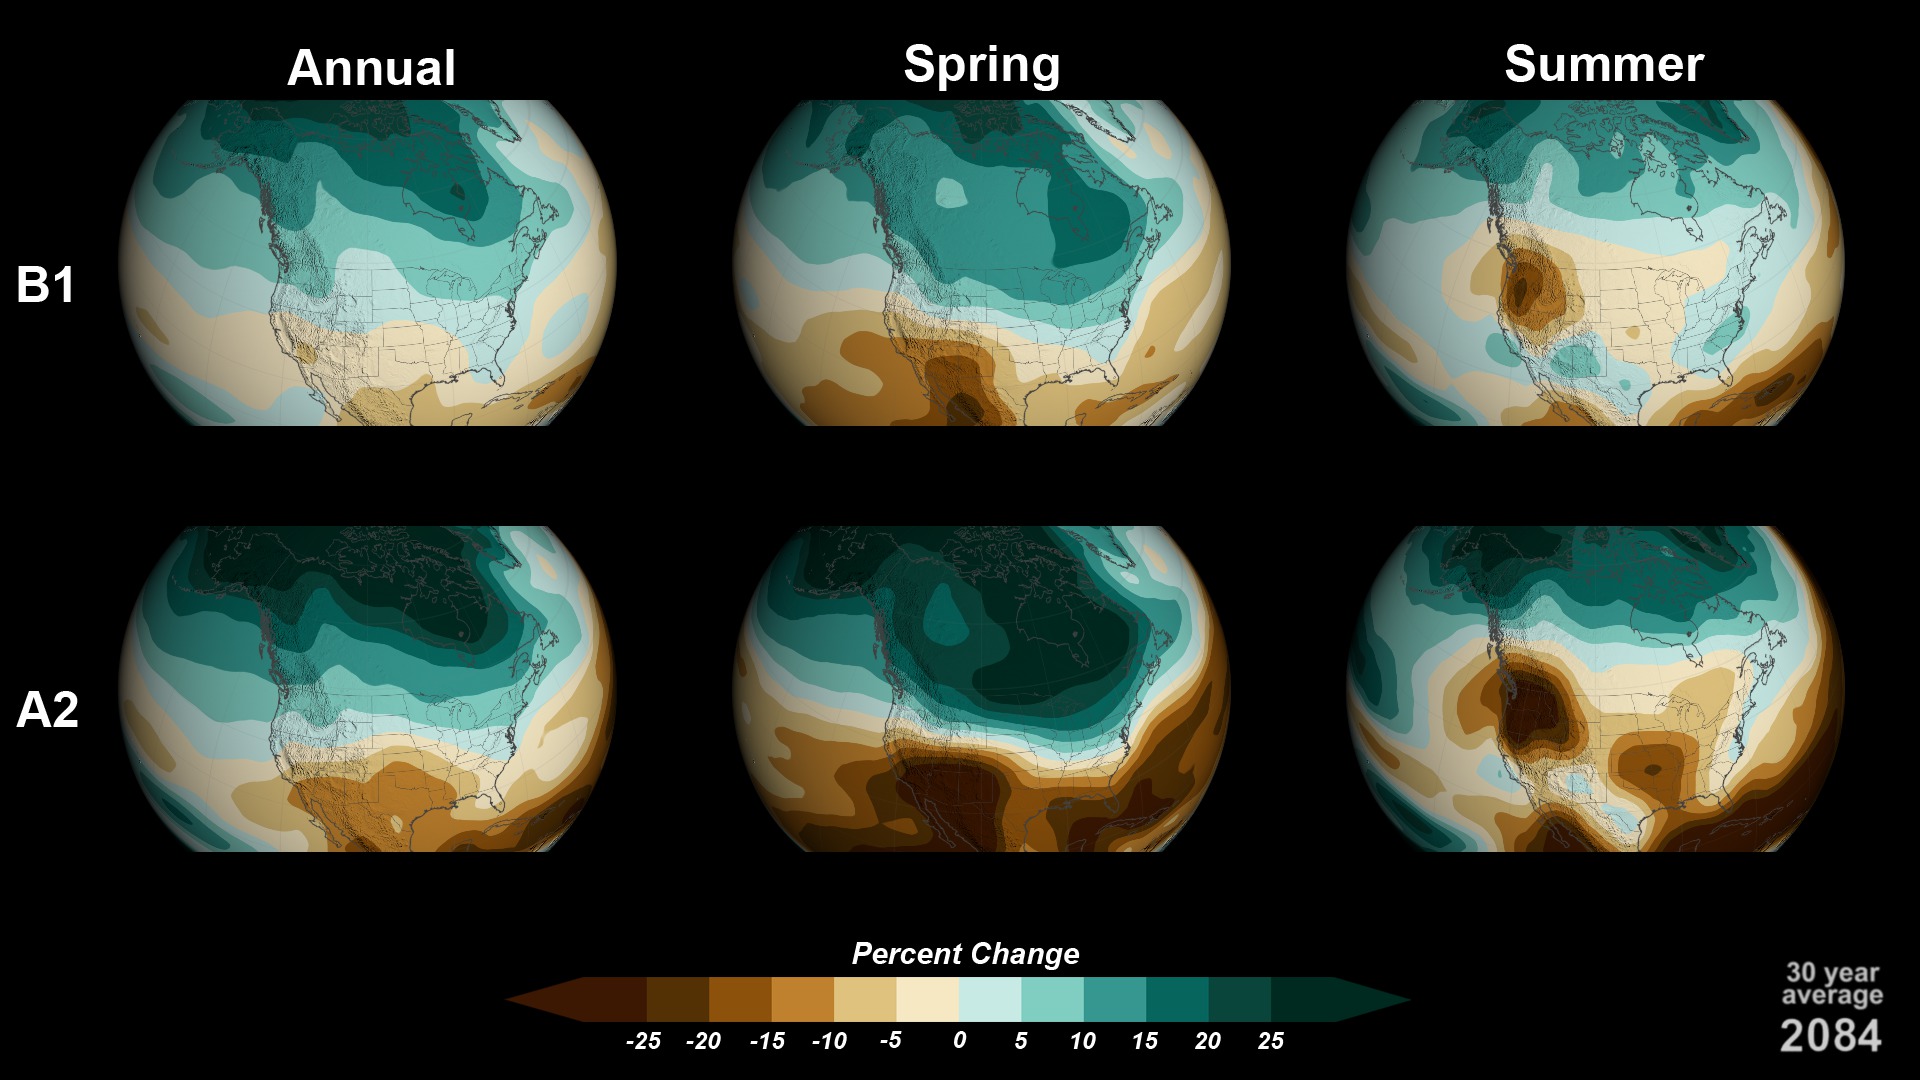
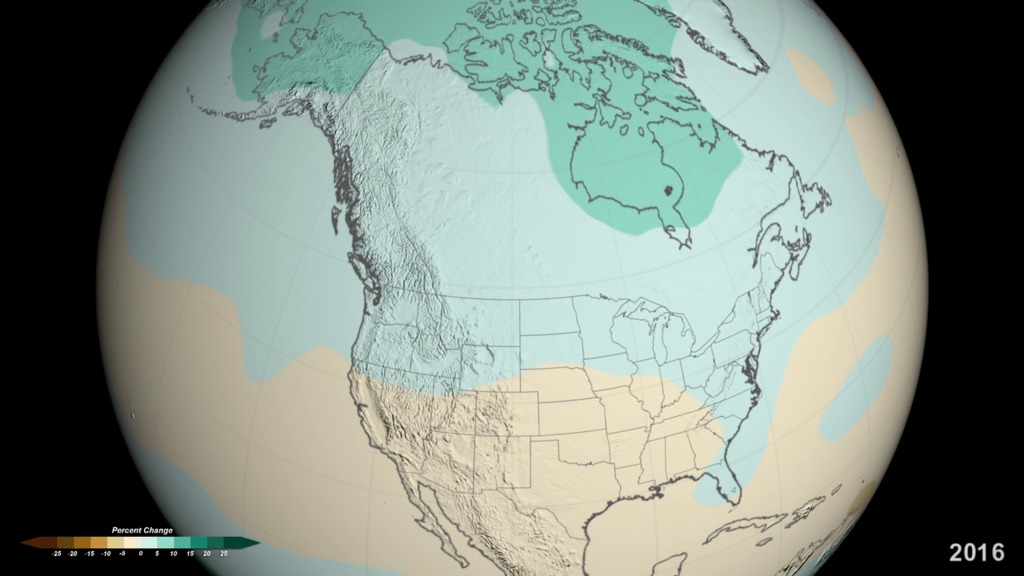
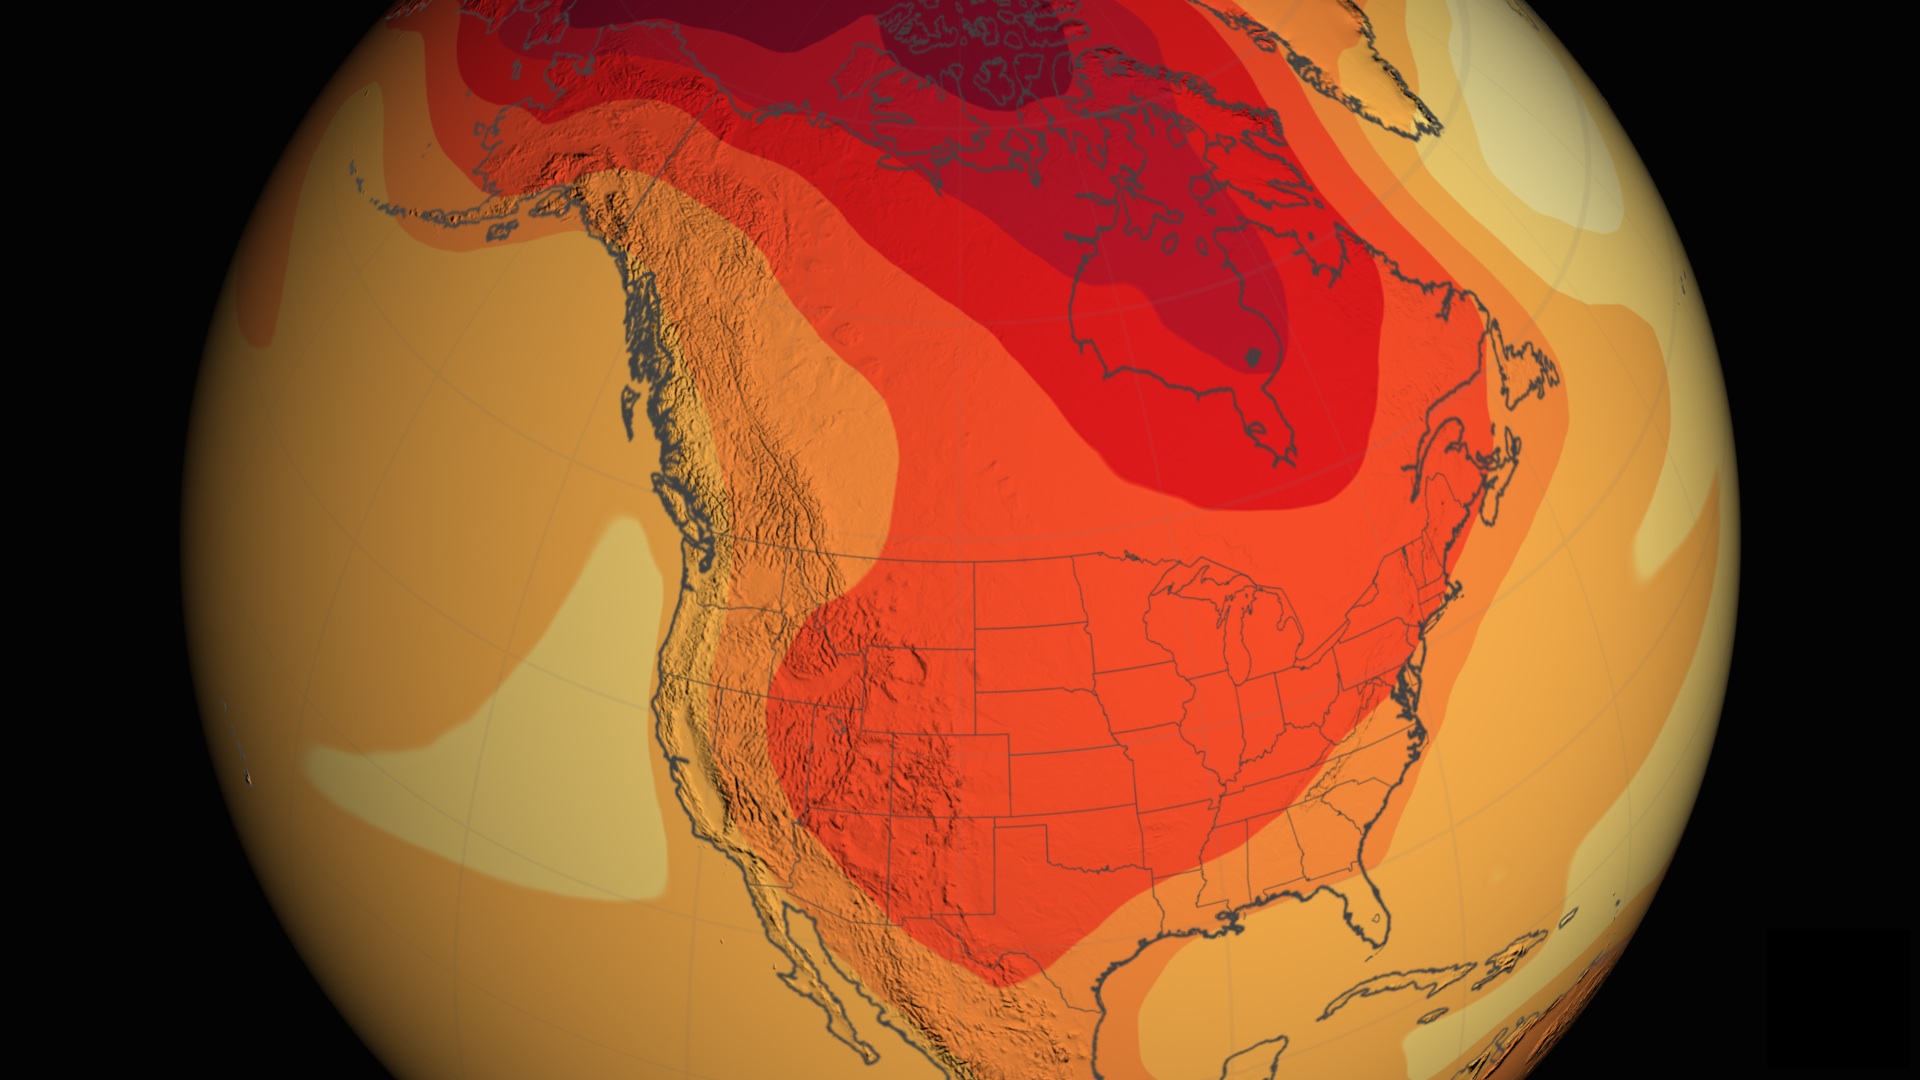
These visualizations show projections of temperature anomalies from 2000 to 2100. For each year, the differences (or anomaly) between the model projected 30-year temperature average and the 1970-1999 average are shown. The dates displayed represent the center of the 30-year average; so, the 30-year spans are ± 15 years from the displayed dates. Separate animations are shown for annual averages and for seasonal averages in the United States. Summer temperatures are displayed due to stakeholder interest in potential extreme heat events. The other seasons are included for completeness.
The data are from fifteen coupled Atmosphere-Ocean General Circulation Models (AOGCMs) from the World Climate Research Programme (WCRP) CMIP3 multi-model dataset (PCMDI 2012). These models are CCSM3, CGCM3.1 (T47), CNRM-CM3, CSIRO-Mk3.0, ECHAM5/MPI-OM, ECHO-G, GFDL-CM2.0, GFDL-CM2.1, INM-CM3.0, IPSL-CM4, MIROC3.2 (medres), MRI-CGCM2.3.2, PCM, UKMO-HadCM3, and UKMO-HadGEM. In those cases where an ensemble of simulations was available from a particular model, only a single ensemble member was used.
These climate model runs use assumptions about possible future development patterns and greenhouse gas emission rates. Two future scenarios are shown: B1 and A2.
- In the B1 scenario, global environmental concerns are emphasized. B1 is a lower greenhouse gas emissions scenario.
- In the A2 scenarios, future socio-economic development and regional issues are emphasized; and, worldwide cooperation on environmental issues is deemphasized. A2 is a higher greenhouse gas emissions scenario.
For each scenario (B1 and A2), five individual temperature anomaly animations are shown for annual, summer, fall, winter, and spring periods. So, there are a total of ten individual animations:
- B1 Annual (lower emissions annual outlook)
- A2 Annual (higher emissions annual outlook)
- B1 Summer (lower emissions outlook of hottest months in US)
- A2 Summer (higher emissions outlook of hottest months in US)
- B1 Fall (lower emissions scenario)
- A2 Fall (higher emissions scenario)
- B1 Winter (lower emissions scenario)
- A2 Winter (higher emissions scenario)
- B1 Spring (lower emissions scenario)
- A2 Spring (higher emissions scenario)
There is also a mosaic of the four most important animations shown for comparison.
Mosaic of annual and summer temperature visualizations
B1 scenario showing annual temperatures
A2 scenario showing Annual temperature
B1 scenario showing temperatures during June, July, and August (US summer)
A2 scenario showing temperatures during June, July, and August (US summer)
B1 scenario showing temperatures during September, October, November (US fall)
A2 scenario showing temperatures during September, October, November (US fall)
B1 scenario showing temperatures during December, January, February (US winter)
A2 scenario showing temperatures during December, January, February (US winter)
B1 scenario showing temperatures during March, April, May (US spring)
A2 scenario showing temperatures during March, April, May (US spring)
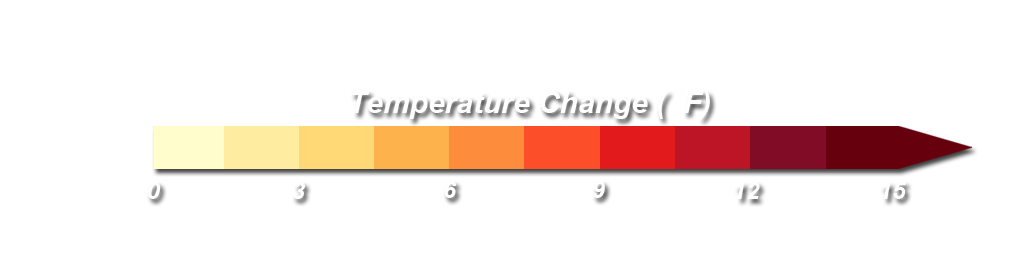
Temperature anomaly color bar in degrees F (lightest colors are near 0; darkest reds are near 15)
Credits
Please give credit for this item to:
National Climate Assessment and NASA's Goddard Space Flight Center Scientific Visualization Studio
-
Animator
- Greg Shirah (NASA/GSFC)
-
Producer
- Allison Leidner (USRA)
-
Scientists
- Kenneth Kunkel (NOAA/NCDC,CICS-NC)
- Brooke Stewart (NOAA/NCDC,CICS-NC)
- Anne Waple (NOAA)
- Laura Stevens (NOAA/NCDC, CICS-NC)
-
Project support
- Andrew Buddenburg (NOAA/NCDC,CICS-NC)
Release date
This page was originally published on Thursday, March 7, 2013.
This page was last updated on Wednesday, May 3, 2023 at 1:52 PM EDT.
Series
This visualization can be found in the following series:Datasets used in this visualization
-
Coupled Model Intercomparison Project Phase 3 (CMIP3)
ID: 771
Note: While we identify the data sets used in these visualizations, we do not store any further details, nor the data sets themselves on our site.
Related
- ID: 11316
 Produced Video
 - ID: 11280
 Produced Video
 - ID: 4028