Drought 2010-2012
The Evaporative Stress Index (ESI) provides objective, high-resolution information about the evaporation of water from land surface. The ESI model combines satellite data with other meteorological factors to determine how much water is used by crops and vegetation. The resulting data helps to detect drought.
This visualization shows ESI data for 2010, 2011, and 2012. 2010 was a relatively wet year despite occasional drought. In 2011, the ESI shows extremely dry conditions across all of Texas, Louisiana, and Oklahoma, tracking one of the country's most devastating droughts. In 2012, the ESI shows plant stress in the Corn Belt region as early as May. These warning signs later developed into a full drought that impacted the world's corn and soy been supply.
The kind of early-warning detection system ESI provides will enhance the US arsenal of drought monitoring tools and help farmers adapt to drought before it evolves.
The ESI tracking system monitors drought by picking up signals of plant stress. This narrated visualization demonstrates how drought developed in 2010, 2011, and 2012.
For complete transcript, click here.
This video is also available on our YouTube channel.

Still image showing Evaporative Stress Index data from June 24, 2011, with a high level of drought in east Texas and Louisiana.
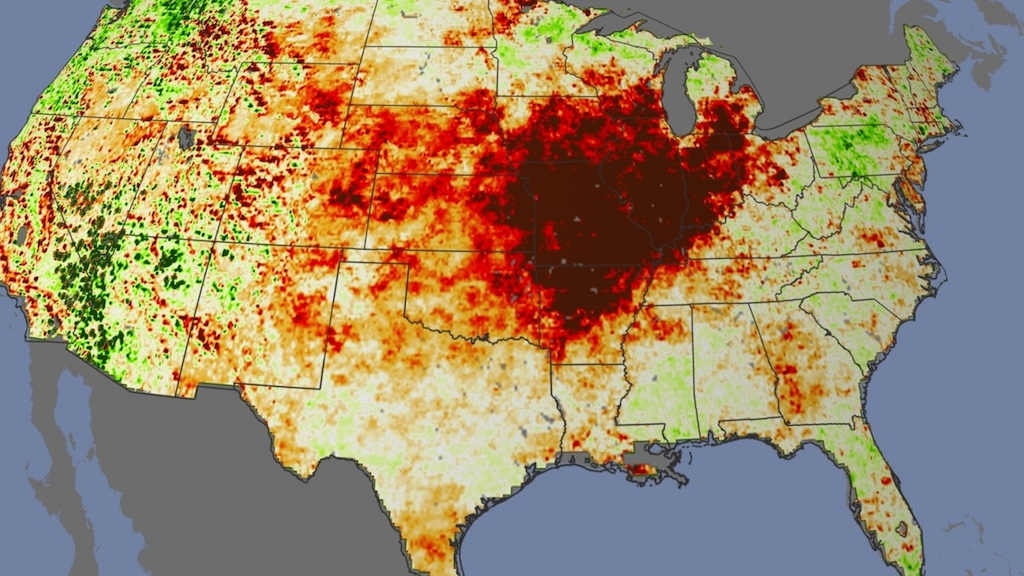
Still image showing Evaporative Stress Index data from August 18, 2012, when the drought in the mideast US was extremely high and spread over several states.
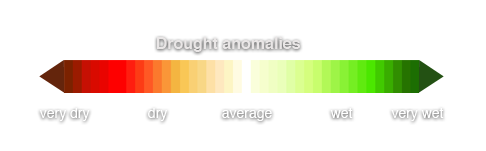
Evaporative Stress Index color scale.
Individual frames of the visualization that show the background and the Evaporative Stress Index data.
Individual frames of the visualization that show only the clock of the seasons with alpha channel. Can be laid over top of the data layer.
Credits
Please give credit for this item to:
NASA's Goddard Space Flight Center Scientific Visualization Studio
-
Animators
- Helen-Nicole Kostis (USRA)
- Greg Shirah (NASA/GSFC)
- Horace Mitchell (NASA/GSFC)
-
Video editor
- Michael Randazzo (Advocates in Manpower Management, Inc.)
-
Producers
- Matthew R. Radcliff (USRA)
- Alison Schuyler Ogden (NASA/GSFC)
-
Scientists
- Martha C. Anderson (USDA-ARS-Hydrology and Remote Sensing Laboratory)
- Wayne P. Dulaney (USDA-ARS-Hydrology and Remote Sensing Laboratory)
- Chris Hain (NASA/MSFC)
-
Writer
- Kathryn Hansen (Wyle Information Systems)
Release date
This page was originally published on Wednesday, December 5, 2012.
This page was last updated on Tuesday, November 14, 2023 at 12:03 AM EST.
Series
This visualization can be found in the following series:Datasets used in this visualization
-
Evaporative Stress Index (ESI)
ID: 963Credit: USDA-ARS Hydrology and Remote Sensing Laboratory (M.C. Anderson) and the NOAA-NESDIS Center for Satellite Applications and Research (C.R. Hain and X. Zhan).
This dataset can be found at: https://hrsl.ba.ars.usda.gov/drought/about.php
See all pages that use this dataset
Note: While we identify the data sets used in these visualizations, we do not store any further details, nor the data sets themselves on our site.
Related
- ID: 11151
 Produced Video