A newer version of this visualization is available.
NASA Earth Observing Fleet including GPM
A newer version of this visualization can be found here.
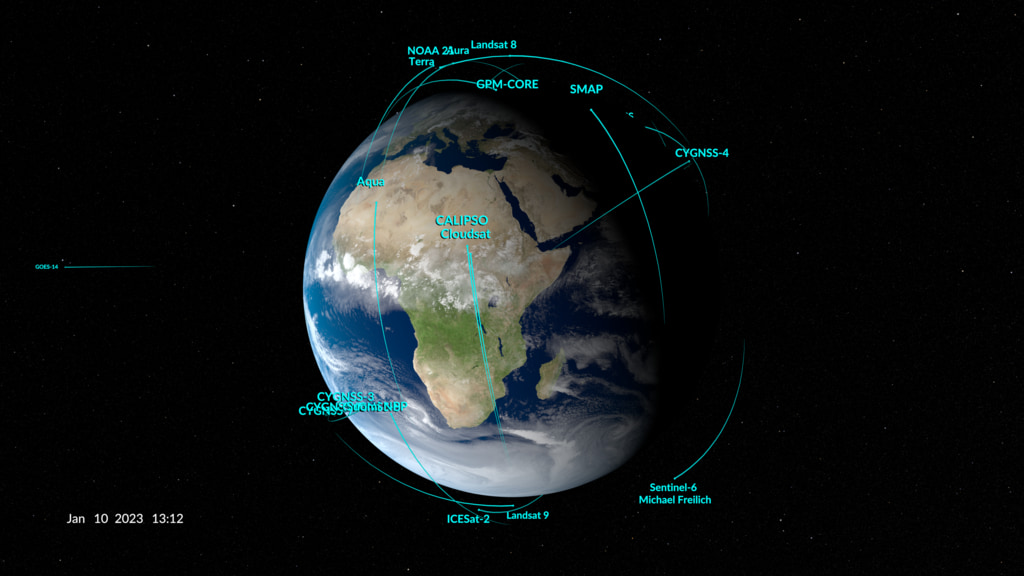
This animation shows the orbits of NASA's current (as of January 2014) fleet of Earth remote sensing observatories. The satellites include components of the A-Train (Aqua, Aura, CloudSat, CALIPSO), two satellites launched in 2011 (Aquarius, Suomi NPP), and eleven others (ACRIMSAT, SORCE, GRACE, Jason 1 and 2, Landsat 7, Landsat 8, GPM, QuikSCAT, TRMM, and EO-1). These satellites measure tropical rainfall, solar irradiance, clouds, sea surface height, ocean salinity, and other aspects of the global environment. Together, they provide a picture of the Earth as a system.
This is an update of visualization #4070. The orbits are based on orbital elements with epochs in April of 2013. The visualization spans twenty-nine hours, from 04:10 UT on April 14, 2013 to 09:24 UT on Aril 15, 2013. Some simulated orbits where added, such as GPM, as they had not launched at the time these visualizations were created.
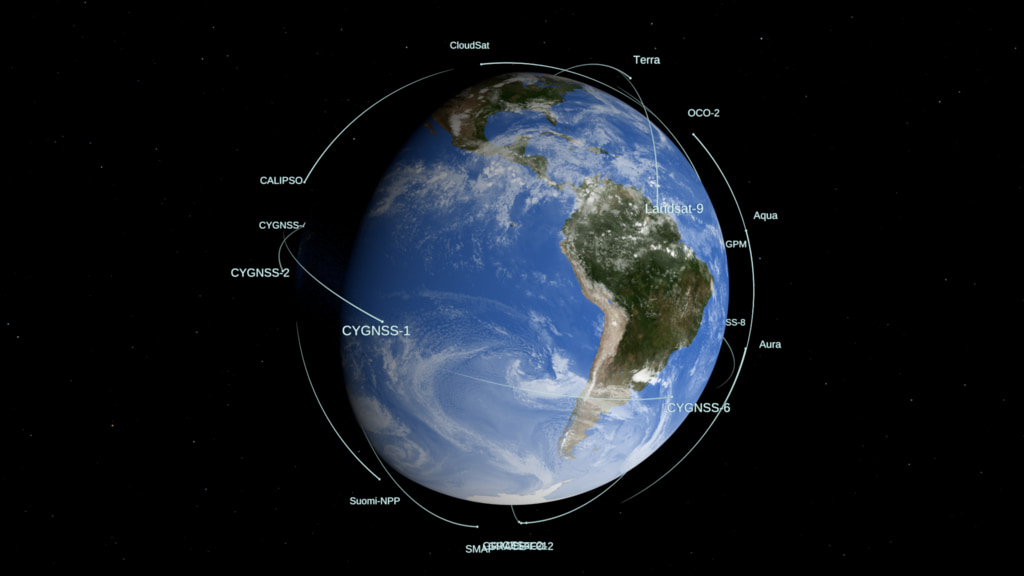
Two versions of this visualization are provided. The first colors the orbits blue except that TRMM is colored green and GPM is colored red. The second visualization colors all of the orbits blue.
NASA's Earth observing fleet including GPM (in red) and TRMM (in green)
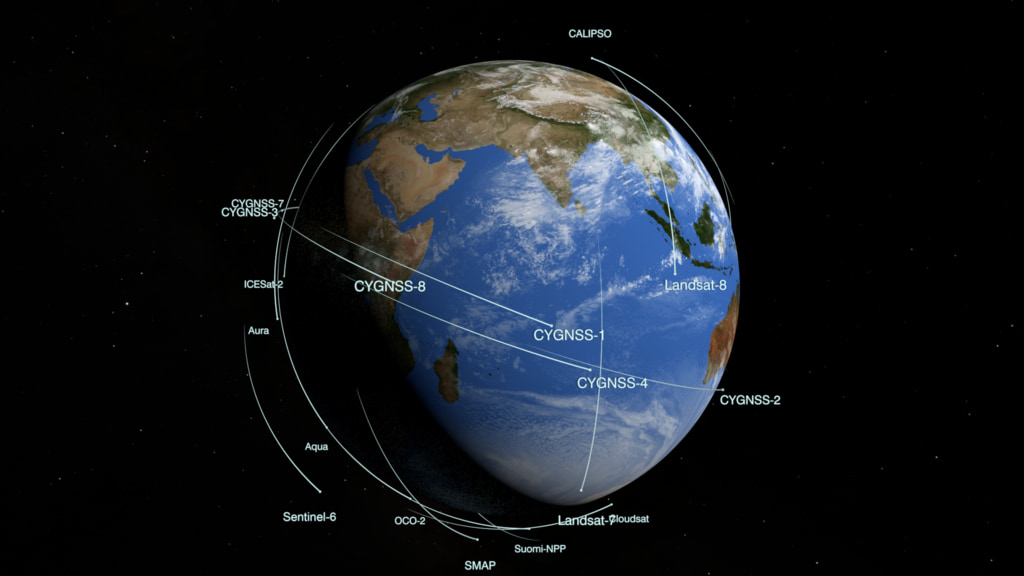
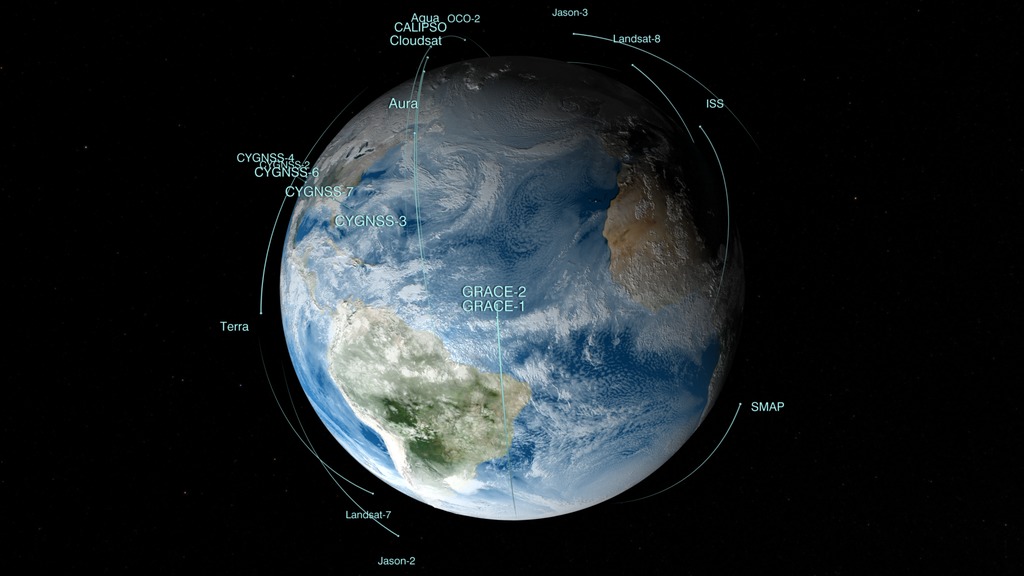
NASA's Earth observing fleet including GPM (all orbits colored blue)
Credits
Please give credit for this item to:
NASA/Goddard Space Flight Center Scientific Visualization Studio
-
Animators
- Greg Shirah (NASA/GSFC)
- Ernie Wright (USRA)
- Alex Kekesi (Global Science and Technology, Inc.)
-
Producers
- Matthew R. Radcliff (USRA)
- Ryan Fitzgibbons (USRA)
Release date
This page was originally published on Monday, January 27, 2014.
This page was last updated on Tuesday, November 14, 2023 at 12:03 AM EST.
Missions
This visualization is related to the following missions:Series
This visualization can be found in the following series:Datasets used in this visualization
-
CelesTrak Spacecraft Orbit Ephemeris
ID: 454This dataset can be found at: http://celestrak.com
See all pages that use this dataset -
BMNG (Blue Marble: Next Generation) [Terra and Aqua: MODIS]
ID: 508Credit: The Blue Marble data is courtesy of Reto Stockli (NASA/GSFC).
This dataset can be found at: http://earthobservatory.nasa.gov/Newsroom/BlueMarble/
See all pages that use this dataset -
GEOS-5 Cubed-Sphere (GEOS-5 Atmospheric Model on the Cubed-Sphere)
ID: 663The model is the GEOS-5 atmospheric model on the cubed-sphere, run at 14-km global resolution for 30-days. GEOS-5 is described here http://gmao.gsfc.nasa.gov/systems/geos5/ and the cubed-sphere work is described here http://sivo.gsfc.nasa.gov/cubedsphere_overview.html.
See all pages that use this dataset
Note: While we identify the data sets used in these visualizations, we do not store any further details, nor the data sets themselves on our site.
Newer Versions
- ID: 5061
 Visualization
 - ID: 4928
 Visualization
 - ID: 4931
 Visualization
 - ID: 4558
 Visualization