Daily Sea Ice during Aug & Sept 2012 with Winds
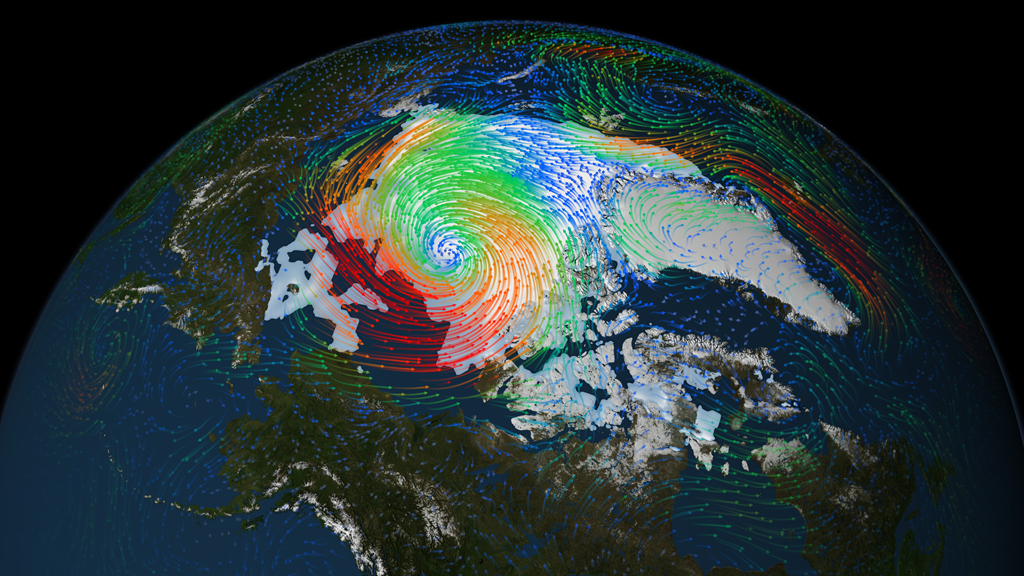
Early in the month of August, 2012, storms in the Arctic affected the motion of the sea ice north of Siberia and Alaska. This animation shows the motion of the winds over the Arctic in conjunction with seasonal melting of the Arctic sea ice from August 1 through September 13, 2012, when the NASA scientists determined that the sea ice reached its annual minimum extent. The surface winds, shown my moving arrows, are colored by the velocity. Slower winds are shown in blue, medium in green and the fast winds are shown in red.
Note: Scientists at the National Snow and Ice Data Center, who calculate the sea ice minimum based on a 5-day trailing average, identified September 16 as the date when the lowest minimum extent occurred. NASA scientists who calculate area on each individual day identified September 13th as the date of the minimum sea ice, although there is little difference in size between the two days.
This animation of the winds over the Arctic plays twice as fast as the one below, showing 7.5 days every 5 seconds.
This movie plays slower.the Arctic plays half as fast as the one above, showing 3.75 days every 5 seconds.

A high resolution still image of the wind flow and sea ice on August 9, 2012.
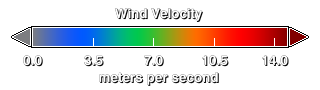
Colorbar for the wind velocity
Credits
Please give credit for this item to:
NASA/Goddard Space Flight Center Scientific Visualization Studio.
Wind data provided by NCEP Reanalysis project at the Earth System Research Laboratory (ESRL) at NOAA's Office of Oceanic and Atmospheric research(NOAA/OAR) from the Physical Sciences Division (PSD) in Boulder, Colorado, USA. For more detail on this data, see their Web site at http://www.esrl.noaa.gov/psd/
The Blue Marble data is courtesy of Reto Stockli (NASA/GSFC).
-
Visualizer
- Cindy Starr (Global Science and Technology, Inc.)
-
Animators
- Greg Shirah (NASA/GSFC)
- Horace Mitchell (NASA/GSFC)
-
Producer
- Jefferson Beck (USRA)
-
Scientists
- Josefino Comiso (NASA/GSFC)
- Robert Gersten (Wyle Information Systems)
-
Project support
- Laurence Schuler (ADNET Systems, Inc.)
- Ian Jones (ADNET Systems, Inc.)
Release date
This page was originally published on Wednesday, September 19, 2012.
This page was last updated on Tuesday, November 14, 2023 at 12:03 AM EST.
Datasets used in this visualization
-
Comiso's Daily Sea Ice Concentration
ID: 539 -
Surface Flux
ID: 759Wind data provided by NCEP Reanalysis project at the Earth System Research Laboratory Physical Sciences Division of NOAA's Office of Oceanic and Atmospheric Research, in Boulder, Colorado, USA.
This dataset can be found at: http://www.esrl.noaa.gov/psd/
See all pages that use this dataset
Note: While we identify the data sets used in these visualizations, we do not store any further details, nor the data sets themselves on our site.
Related
- ID: 11082
 Produced Video