Greenland Ice Flow
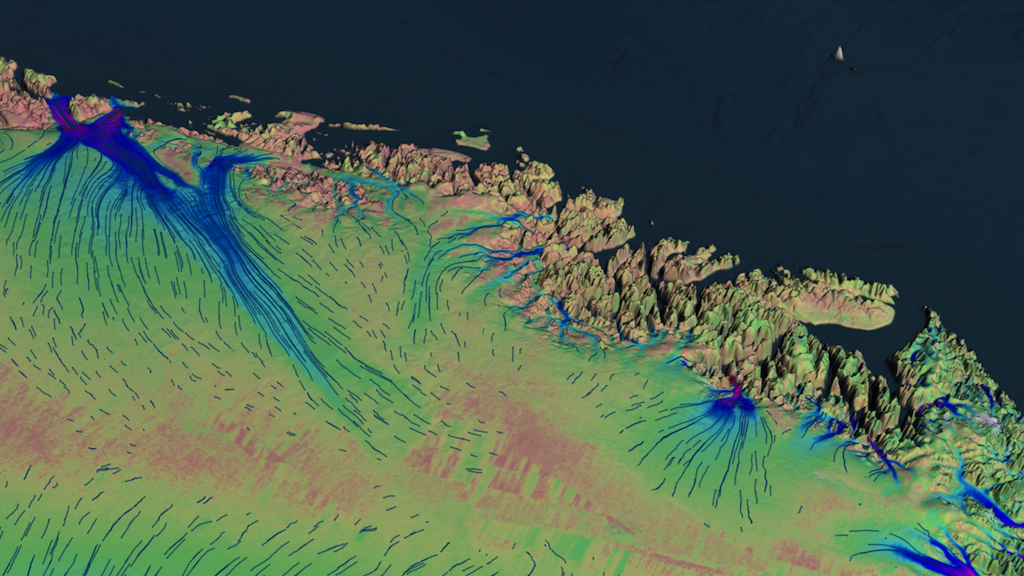
Greenland looks like a big pile of snow seen from space using a regular camera. But satellite radar interferometry helps us detect the motion of ice beneath the snow. Ice starts flowing from the flanks of topographic divides in the interior of the island, and increases in speed toward the coastline where it is channelized along a set of narrow, powerful outlet glaciers. In the east, these glaciers make their sinuous way through complex terrain at low speed. They form long floating extensions that deform slowly in the cold north. As we move toward sectors of higher snowfall in the northwest and center west, ice flow speeds increase by nearly a factor of 10, with many, smaller glaciers flowing straight down to the coastline at several kilometers per year.
This complete description of ice motion was only made possible from the coordinated effort of four space agencies: the Japanese Space Agency, the Canadian Space Agency, the European Space Agency, and NASA's Jet Propulsion Laboratory. The data will help scientists improve their understanding of the dynamics of ice in Greenland and in projecting how the Greenland Ice Sheet will respond to climate change in the decades and centuries to come.
This animation shows how ice is naturally transported from interior topographic divides to the coast via glaciers. The colors represent the speed of ice flow, with areas in red and purple flowing the fastest at rates of kilometers per year. The vectors indicate the direction of flow.
This video is also available on our YouTube channel.

A high resolution still image showing the velocity flow over Greenland.
A high resolution still image showing the velocity flow over the Nioghalvfjerdsbrae Glacier, also known as "79 N Glacier", in Greenland.
A high resolution still image showing the velocity flow on the west coast of Greenland.
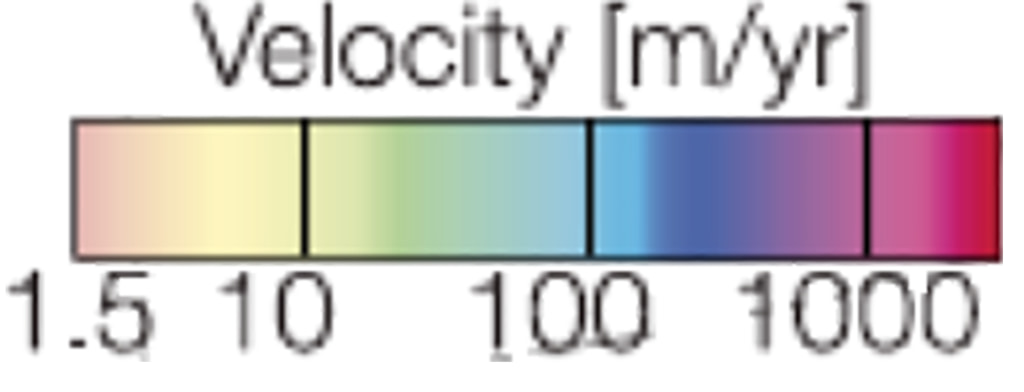
Ice Flow Colortable in a logarithmic scale
Credits
Please give credit for this item to:
NASA/Goddard Space Flight Center Scientific Visualization Studio
The topographic data used in the video are unpublished but courtesy of Ian Howat, The Ohio State University, Columbus, OH.
The MOG mosaic (MODIS) is courtesy of T. Scambos, NSDIC, Bouder, CO.
-
Visualizer
- Cindy Starr (Global Science and Technology, Inc.)
-
Animators
- Horace Mitchell (NASA/GSFC)
- Greg Shirah (NASA/GSFC)
-
Narrator
- Eric J. Rignot (NASA/JPL CalTech)
-
Producers
- Jefferson Beck (USRA)
- Alan Buis (NASA/JPL CalTech)
-
Scientists
- Eric J. Rignot (NASA/JPL CalTech)
- Jeremie Mouginot (University of California, Irvine)
- Ian Howat (Ohio State University)
- Ted Scambos (NSIDC)
-
Project support
- Laurence Schuler (ADNET Systems, Inc.)
- Ian Jones (ADNET Systems, Inc.)
Release date
This page was originally published on Monday, July 2, 2012.
This page was last updated on Tuesday, November 14, 2023 at 12:02 AM EST.
Missions
This visualization is related to the following missions:Papers used in this visualization
https://agupubs.onlinelibrary.wiley.com/doi/epdf/10.1029/2012GL051634
Datasets used in this visualization
-
BMNG (Blue Marble: Next Generation) [Terra and Aqua: MODIS]
ID: 508Credit: The Blue Marble data is courtesy of Reto Stockli (NASA/GSFC).
This dataset can be found at: http://earthobservatory.nasa.gov/Newsroom/BlueMarble/
See all pages that use this dataset -
GIMP Greenland DEM (Greenland Mapping Project (GIMP) Digital Elevation Model)
ID: 746 -
Digital Mosaic of Ice Motion in Greenland
ID: 747Digital Mosaic of Ice Motion in Greenland from satellite radar interferometry data acquired during the International Polar Year 2008 to 2009 by the Envisat Advanced Synthetic-Aperture Radar (ASAR), the Advanced Land Observation System (ALOS)'s Phase-Array L-band SAR (PALSAR) and the RADARSAT-1 SAR
See all pages that use this dataset -
Greenland Ice Sheet Velocity
ID: 770Assembled from satellite radar interferometry data acquired during the International Polar Year (2008-2009). The satellites are Envisat Advanced Synthetic-Aperture Radar (ASAR), Advanced Land Observation System's (ALOS) Phase-Array L-band SAR (PALSAR), RADARSAT-1 SAR
See all pages that use this dataset
Note: While we identify the data sets used in these visualizations, we do not store any further details, nor the data sets themselves on our site.
Related
- ID: 11064
 Produced Video