A newer version of this visualization is available.
Pulse of Snow and Sea Ice
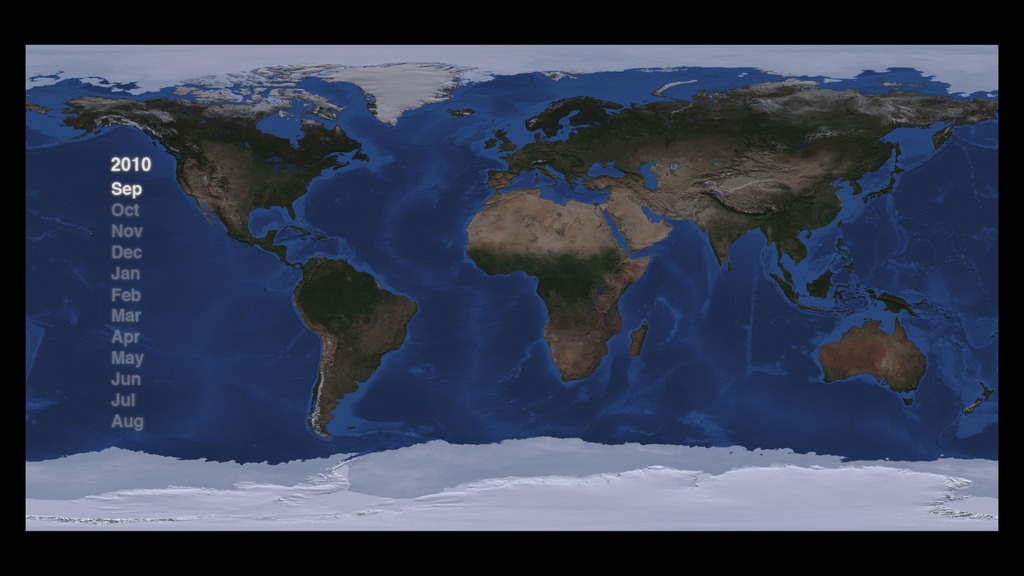
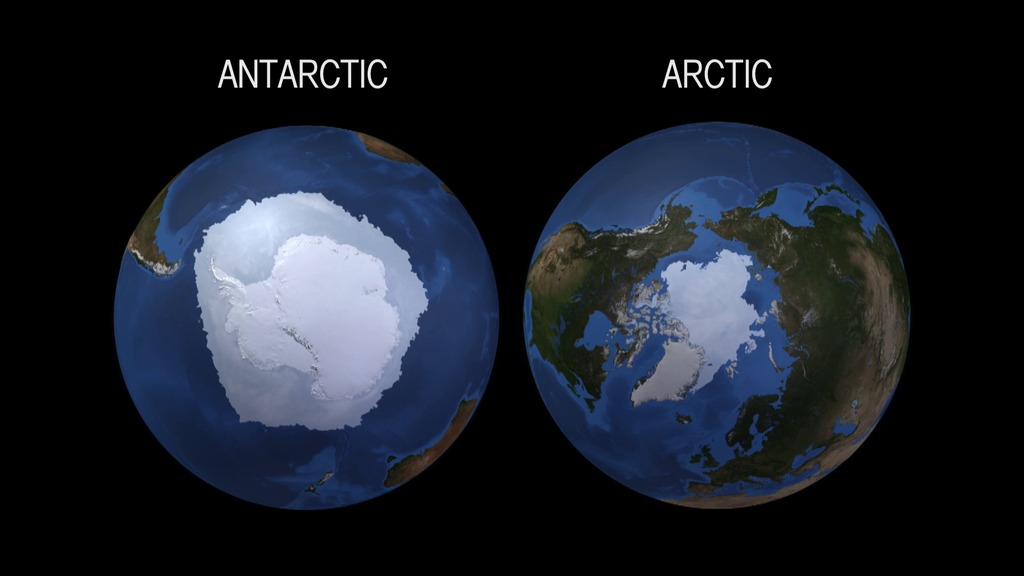
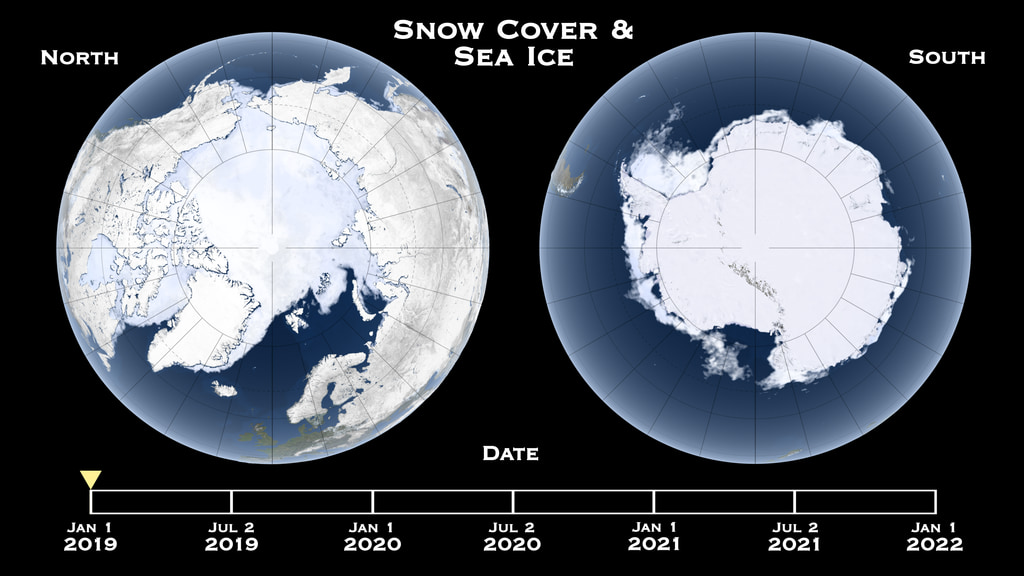
Snow and sea ice in the Northern and Southern Hemispheres pulse at exact opposite times of year, constantly out of phase.
North and South Pole snow cover and sea ice visualization.
This set of frames provides the dates layer only.
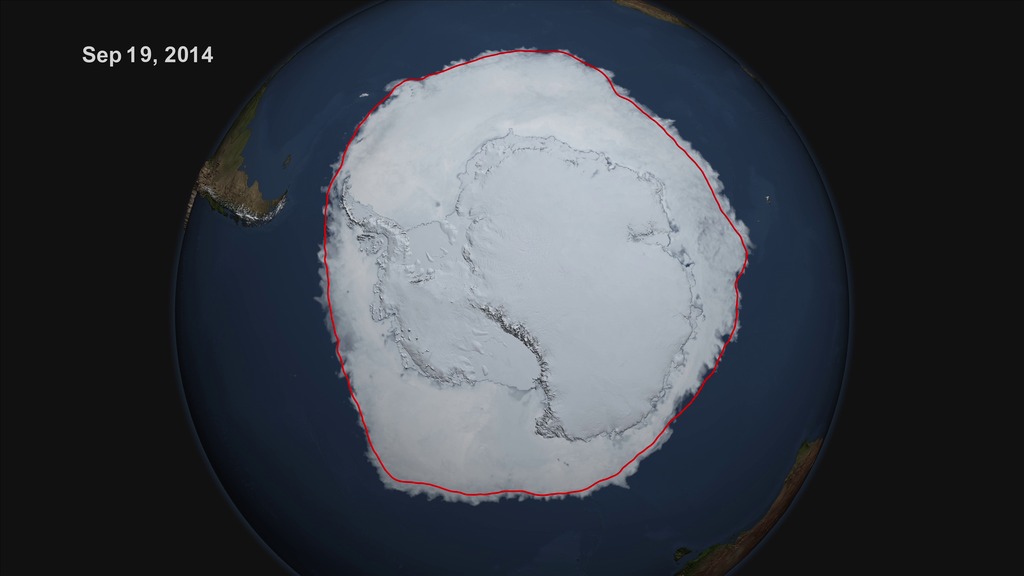
This set of frames provides the South Pole snow cover and sea ice visualization only (with transparency).
This set of frames provides the North Pole snow cover and sea ice visualization (with transparency).
Credits
Please give credit for this item to:
NASA/Goddard Space Flight Center Scientific Visualization Studio
-
Animator
- Helen-Nicole Kostis (USRA)
-
Visualizer
- Cindy Starr (Global Science and Technology, Inc.)
-
Scientist
- Thorsten Markus (NASA/GSFC)
Release date
This page was originally published on Monday, May 14, 2012.
This page was last updated on Wednesday, May 3, 2023 at 1:53 PM EDT.
Missions
This visualization is related to the following missions:Datasets used in this visualization
-
Daily L3 6.25 km 89 GHz Brightness Temperature (Tb) [Aqua: AMSR-E]
ID: 236 -
Sea Ice Concentration (Daily L3 12.5km Tb, Sea Ice Concentration, and Snow Depth) [Aqua: AMSR-E]
ID: 237 -
Snow Cover Daily L3 Global 0.05Deg CMG (MOD10C1) [Terra: MODIS]
ID: 504 -
BMNG (Blue Marble: Next Generation) [Terra and Aqua: MODIS]
ID: 508Credit: The Blue Marble data is courtesy of Reto Stockli (NASA/GSFC).
This dataset can be found at: http://earthobservatory.nasa.gov/Newsroom/BlueMarble/
See all pages that use this dataset -
Bathymetry [Terra: MODIS]
ID: 569
Note: While we identify the data sets used in these visualizations, we do not store any further details, nor the data sets themselves on our site.
Related
- ID: 3899
 Visualization
 - ID: 11703
 Produced Video
 - ID: 11704
Newer Versions
- ID: 4995
 Visualization