Biosphere Data 2000 through 2004
The SeaWiFS instrument aboard the SeaStar satellite has been collecting ocean data since 1997. By monitoring the color of reflected light via satellite, scientists can determine how successfully plant life is photosynthesizing. A measurement of photosynthesis is essentially a measurement of successful growth, and growth means successful use of ambient carbon. This animation represents nearly a decade's worth of data taken by the SeaWiFS instrument, showing the abundance of life in the sea and along the Western seaboard of the United States. Dark blue represents warmer areas where there is little life due to lack of nutrients, and greens and reds represent cooler nutrient-rich areas. The nutrient-rich areas include coastal regions where cold water rises from the sea floor bringing nutrients along and areas at the mouths of rivers where the rivers have brought nutrients into the ocean from the land. The nutrient-rich waters contribute to some of the oxygen-poor pockets of the seas called dead zones.
Animation depicting nearly four years worth of SeaWiFS ocean chlorophyll concentration and Next Generation BlueMarble land.

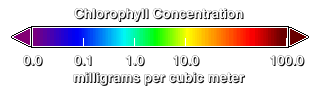
Chlorophyll colorbar
This is a match framed animation as the above frame set, except this frame set has a plain blue ocean without the chlorophyll.
Credits
Please give credit for this item to:
NASA/Goddard Space Flight Center, The SeaWiFS Project and GeoEye, Scientific Visualization Studio. NOTE: All SeaWiFS images and data presented on this web site are for research and educational use only. All commercial use of SeaWiFS data must be coordinated with GeoEye (NOTE: In January 2013, DigitalGlobe and GeoEye combined to become DigitalGlobe).
-
Animator
- Lori Perkins (NASA/GSFC)
-
Producer
- Michael Starobin (HTSI)
-
Scientist
- Gene Feldman (NASA/GSFC)
-
Project support
- Norman Kuring (NASA/GSFC)
Release date
This page was originally published on Wednesday, April 11, 2012.
This page was last updated on Wednesday, May 3, 2023 at 1:53 PM EDT.
Series
This visualization can be found in the following series:Datasets used in this visualization
-
Global Biosphere [SeaStar: SeaWiFS]
ID: 467SeaWiFS Global Biosphere is a combination of the Land NDVI and Chlorophyll Concentration data sets. All SeaWiFS images and data presented on this web site are for research and educational use only. All commercial use of SeaWiFS data must be coordinated with GeoEye.
Credit: NASA/Goddard Space Flight Center, The SeaWiFS Project and GeoEye, Scientific Visualization Studio. NOTE: All SeaWiFS images and data presented on this web site are for research and educational use only. All commercial use of SeaWiFS data must be coordinated with GeoEye (NOTE: In January 2013, DigitalGlobe and GeoEye combined to become one DigitalGlobe.).
This dataset can be found at: http://oceancolor.gsfc.nasa.gov/PRODUCTS/
See all pages that use this dataset
Note: While we identify the data sets used in these visualizations, we do not store any further details, nor the data sets themselves on our site.