The Local Interstellar Wind as Seen by IBEX
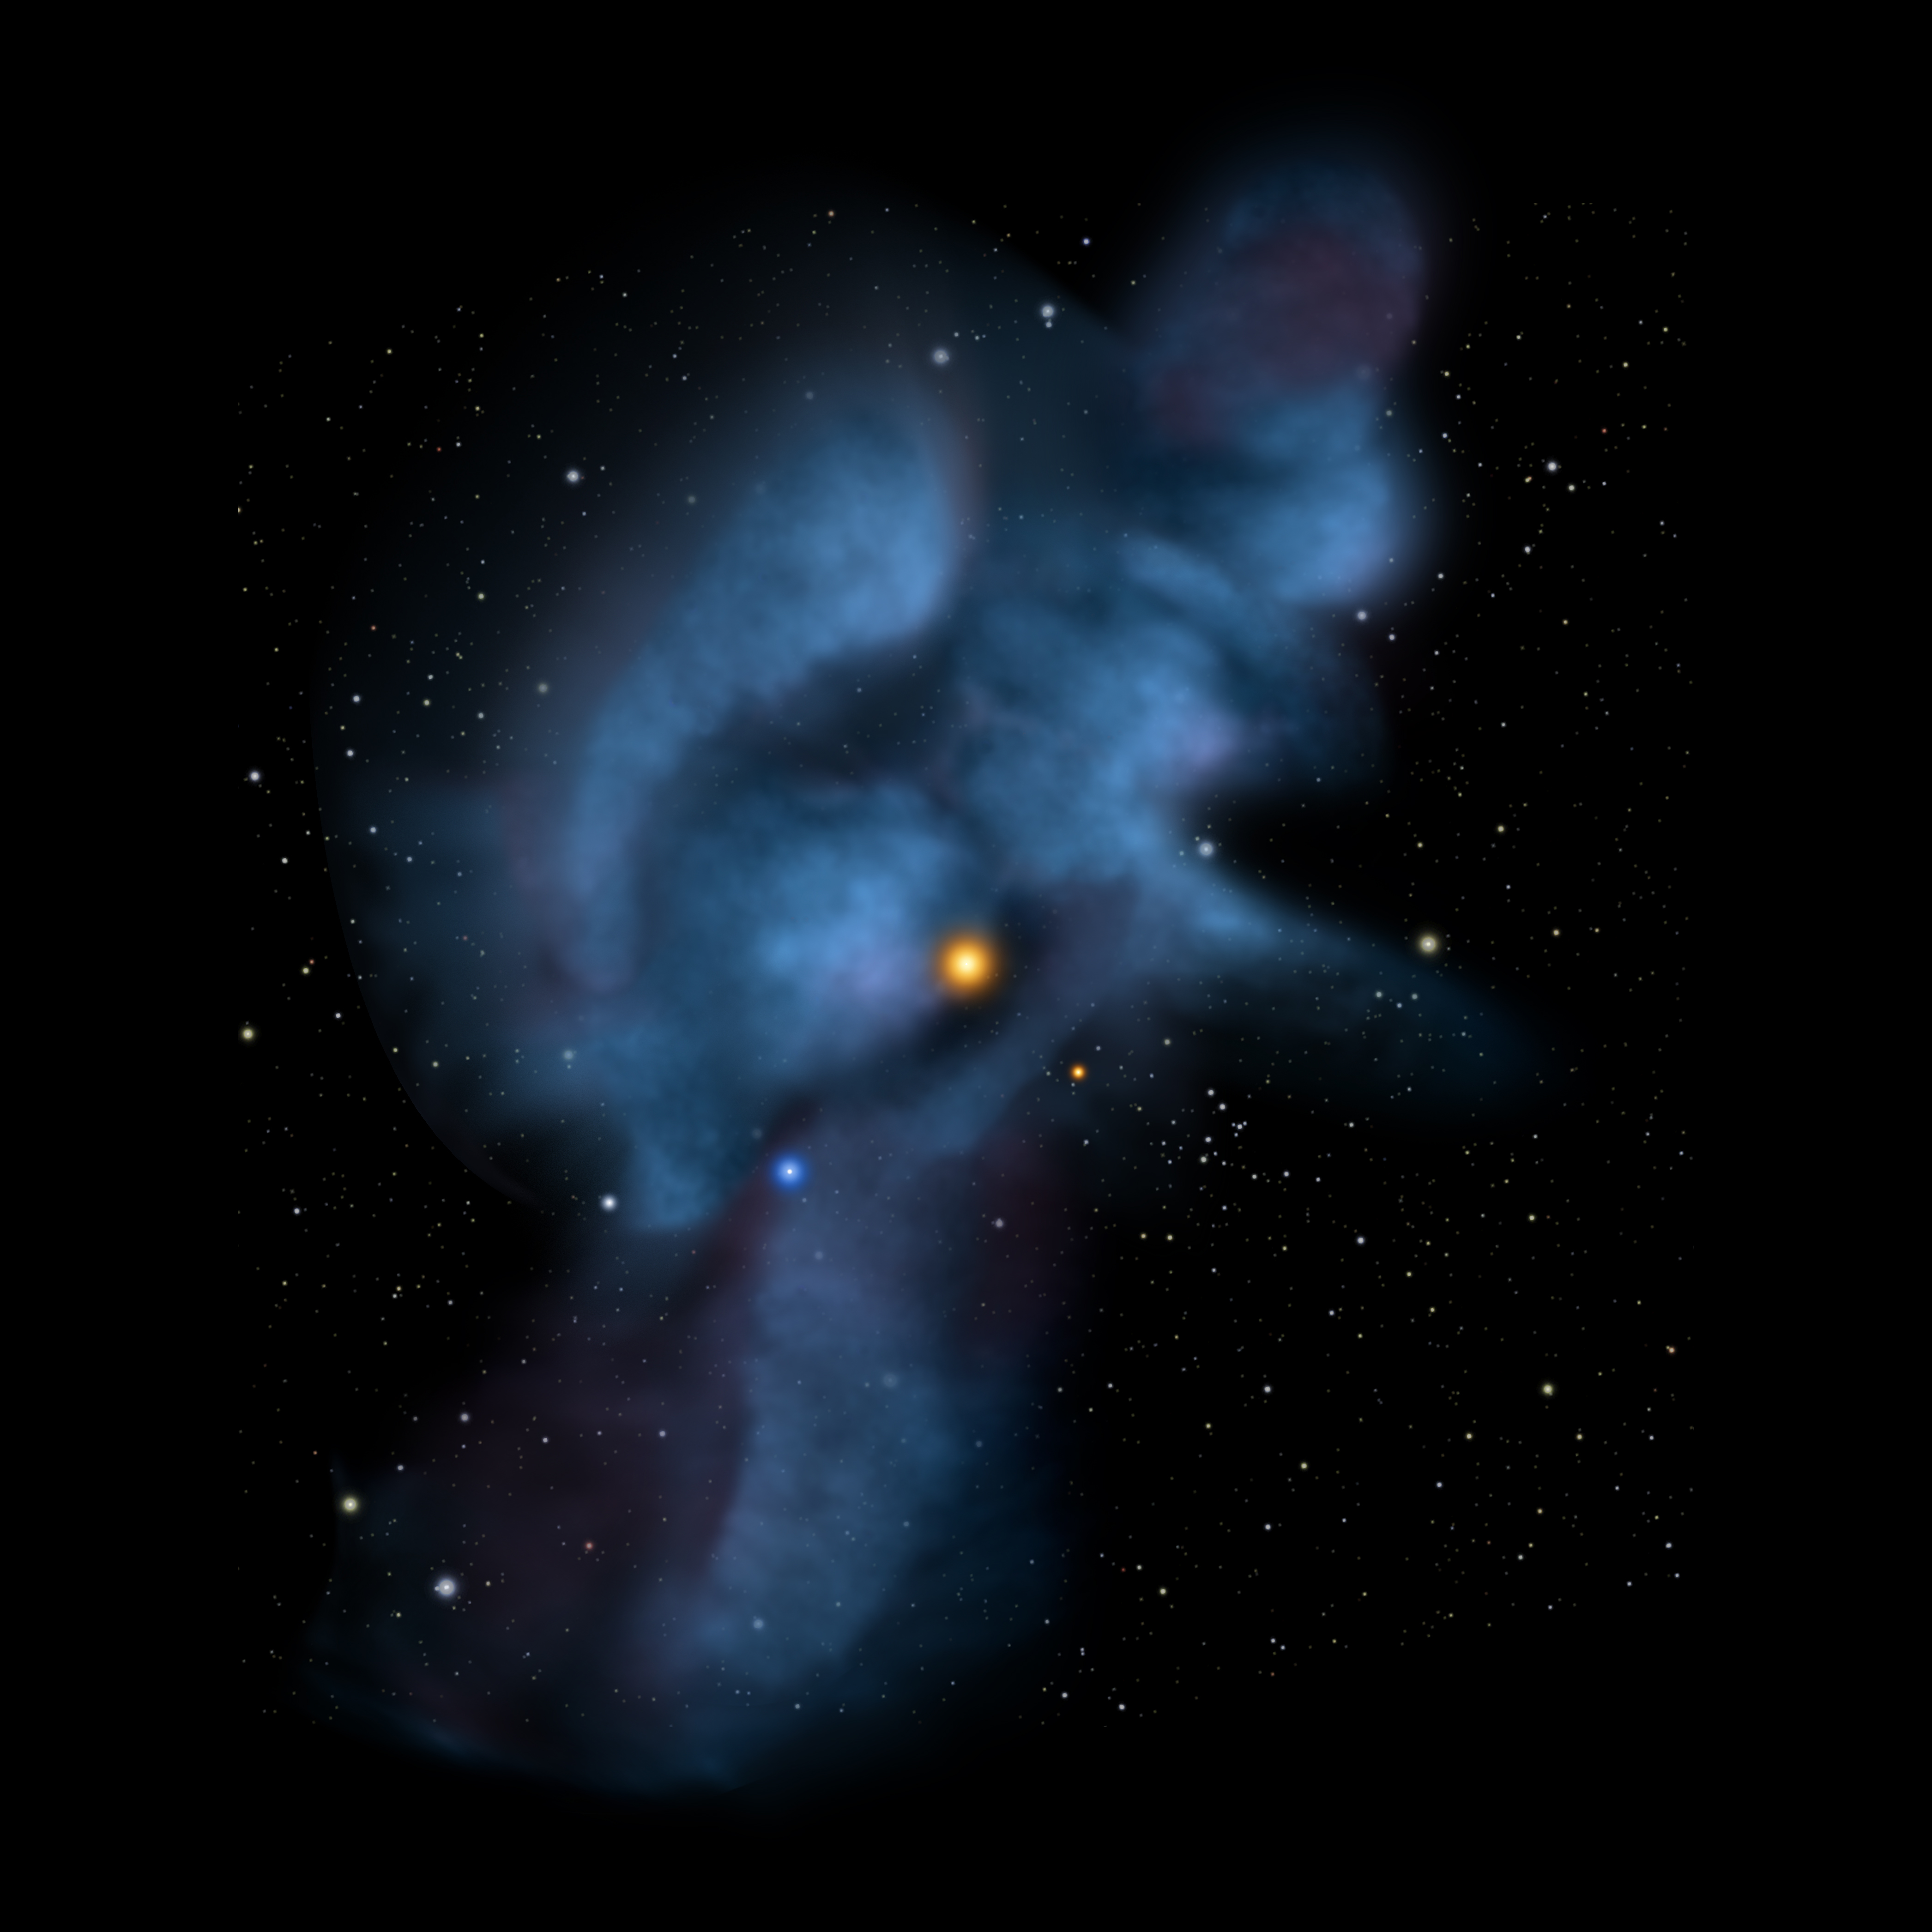
This visual presents a color-coded full-sky neutral atom map in a Hammer projection. This map is different from earlier IBEX maps in that it shows atoms only at energies where the interstellar wind is the brightest feature in the maps.
In Earth's orbit, where IBEX makes its observations, the maximum flow (in red) is seen to arrive from Libra instead of Scorpio because the interstellar wind is forced to curve around the Sun by gravity.

Polished version of the annotated skymap with glows added to stars and drop-shadows added to text.
Simple compositing of data, stars, and labels.
IBEX Interstellar (Galactic) wind in Hammer projection.
Labels in Hammer projection.
Brighter stars in Hammer projection
Color bar for neutral atom map.
Credits
Please give credit for this item to:
NASA/Goddard Space Flight Center Scientific Visualization Studio and the University of New Hampshire.
-
Animator
- Tom Bridgman (Global Science and Technology, Inc.)
-
Producers
- Scott Wiessinger (USRA)
- Genna Duberstein (USRA)
-
Scientists
- Dave McComas (SwRI)
- Nathan Schwadron (University of New Hampshire)
Release date
This page was originally published on Tuesday, January 31, 2012.
This page was last updated on Wednesday, May 3, 2023 at 1:53 PM EDT.
Missions
This visualization is related to the following missions:Series
This visualization can be found in the following series:Datasets used in this visualization
-
[IBEX]
ID: 207
Note: While we identify the data sets used in these visualizations, we do not store any further details, nor the data sets themselves on our site.
Related
- ID: 10906