Carbon Monoxide
AIRS' global carbon monoxide measurements are important because scientists can monitor the transport of fire emissions around the globe on a daily basis. Previously, carbon monoxide measurements came from satellite instruments that saw only part of the Earth each day or from weather balloons. Prior to AIRS, scientists had to integrate those observations with computer models to infer the day-to-day impact of fire emissions on the atmosphere. AIRS provides daily, global coverage. AIRS also measures some of the key atmospheric gases that affect climate, including ozone, methane, and dust and other aerosols.
Tropospheric CO abundances are retrieved from the 4.67 m region of AIRS spectra as one of the last steps of the AIRS team algorithm. AIRS' 1600 km cross-track swath and cloud-clearing retrieval capabilities provide daily global CO maps over approximately 70% of the Earth.
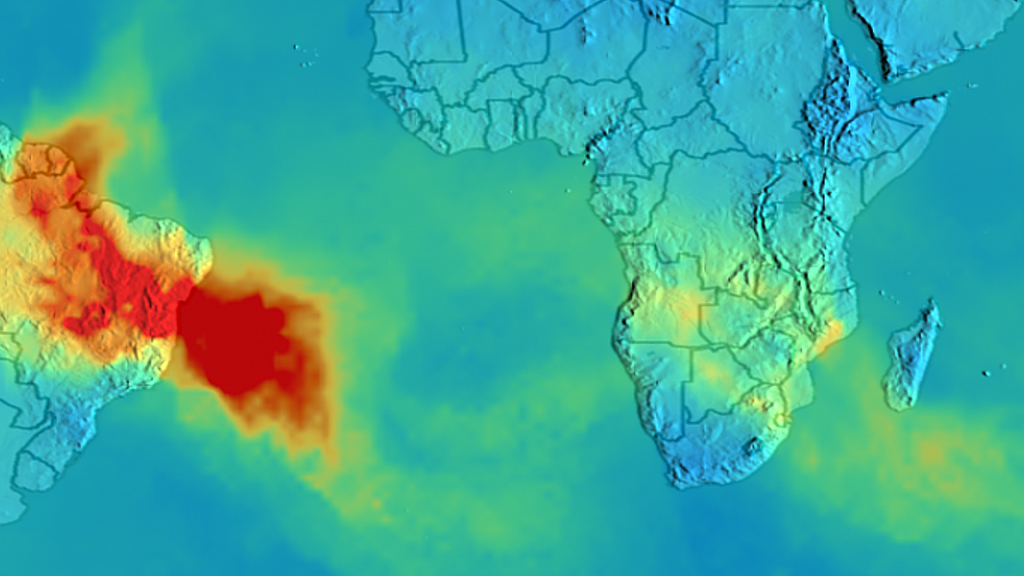
The streak of red, orange, and yellow across South America, Africa, and the Atlantic Ocean in this animation points to high levels of carbon monoxide, as measured by the Atmospheric Infrared Sounder (AIRS) instrument flying on NASA's Aqua satellite. The carbon monoxide primarily comes from fires burning in the Amazon basin, with some additional contribution from fires in southern Africa. The animation shows carbon monoxide transport sweeping east throughout August, September, and October 2005.
The streak of red, orange, and yellow across South America, Africa, and the Atlantic Ocean in this image points to high levels of carbon monoxide on September 30, 2005.
This product is available through our Web Map Service.

Colorbar for AIRS Mid Tropospheric Carbon Monoxide
This frame set has the AIRS carbon monoxide imagery with dates. It does not include the colorbar overlay.
This display image occurs 9 days after the display image in the frameset above. Notice the carbon monoxide has transported from South America over the Atlantic Ocean to Africa and over the Indian Ocean to Aulstralia.
This frame set has the AIRS carbon monoxide imagery with no dates and no colorbar overlay. It is designed to be displayed on the Magic Planet.
Credits
Please give credit for this item to:
NASA/Goddard Space Flight Center Scientific Visualization Studio
-
Animator
- Lori Perkins (NASA/GSFC)
-
Scientists
- Tom Pagano (NASA/JPL CalTech)
- Edward Olsen (NASA/JPL CalTech)
- Hai Nguyen (California Institute of Technology)
Release date
This page was originally published on Tuesday, November 8, 2011.
This page was last updated on Tuesday, November 14, 2023 at 12:01 AM EST.
Datasets used in this visualization
-
Carbon Monoxide [Aqua: AIRS]
ID: 590
Note: While we identify the data sets used in these visualizations, we do not store any further details, nor the data sets themselves on our site.
Related
- ID: 10853
 Produced Video