West Antarctic Glacier Ice Flows and Elevation Change
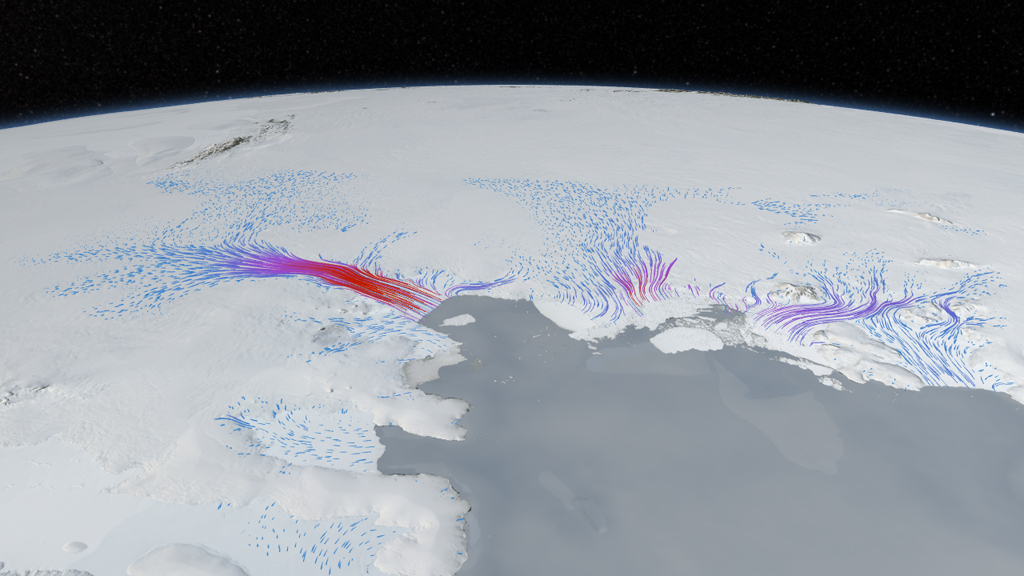
This animation shows glacier changes detected by ATM, ICESat and ice bridge data in the highly dynamic Amundsen Embayment of West Antarctica. We know that ice speeds in this area have increased dramatically from the late 1990s to the present as the ice shelves in this area have thinned and the bottom of the ice has lost contact with the bed beneath. As the ice has accelerated, ice upstream of the coast must be stretched more vigorously, causing it to thin. NASA-sponsored aircraft missions first measured the ice surface height in this region in 2002, followed by ICESat data between 2002 and 2009. Ice Bridge aircraft have measured further surface heights in 2009 and 2010, and these measurements continue today. Integrating these altimetry sources allows us to estimate surface height changes throughout the drainage regions of the most important glaciers in the region. We see large elevation changes at the coast on Thwaites glacier, at the center of the images, and large and accelerating elevation changes extending inland from the coast on Pine Island and Smith glaciers, to the left and right of the images, respectively. The changes on Pine Island and Smith glaciers mark these as potential continuing sources of ice to the sea, and they have been surveyed in 2011 by Ice Bridge aircraft and targeted for repeat measurements in coming years.
Animation showing ice velocity and elevation change with dates, labels and colorbars.
The above animation without the title, date and colorbar overlay
The label, date and colorbar overlay with transparency
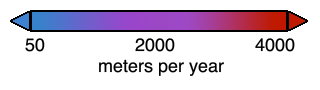
The color bar used to show the ice velocity vector flows
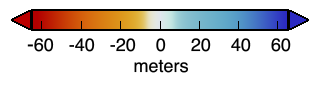
The color bar used to show the change in elevation
Credits
Please give credit for this item to:
NASA/Goddard Space Flight Center Scientific Visualization Studio
-
Visualizer
- Cindy Starr (Global Science and Technology, Inc.)
-
Producer
- Jefferson Beck (USRA)
-
Scientist
- Benjamin E. Smith (University of Washington Applied Physics Lab Polar Science Center)
-
Project support
- James W. Williams (Global Science and Technology, Inc.)
- Shiloh Heurich (Global Science and Technology, Inc.)
Release date
This page was originally published on Wednesday, November 2, 2011.
This page was last updated on Tuesday, November 14, 2023 at 12:01 AM EST.
Missions
This visualization is related to the following missions:Datasets used in this visualization
-
LIMA (Landsat Image Mosaic of Antarctica) [Landsat-7: ETM+]
ID: 599Mosaicing to avoid clouds produced a high quality, nearly cloud-free benchmark data set of Antarctica for the International Polar Year from images collected primarily during 1999-2003.
This dataset can be found at: http://lima.nasa.gov/
See all pages that use this dataset -
GLA14 (L2 Global Land Surface Altimetry Data) [ICESat: GLAS]
ID: 716 -
L2 Icessn Elevation, Slope, and Roughness [IceBridge: ATM]
ID: 717 -
L2 Icessn Elevation, Slope, and Roughness [Pre-IceBridge: ATM]
ID: 718 -
BLVIS2 (L2 Geolocated Ground Elevation and Return Energy Quartiles) [Pre-IceBridge: LVIS]
ID: 719 -
Differential Interferometry [ERS-1 and ERS-2: SAR]
ID: 720 -
L-band frequency (1.27 GHz) radar [Advanced Land Observation System (ALOS): Phased-Array Synthetic-Aperture Radar (PALSAR)]
ID: 721
Note: While we identify the data sets used in these visualizations, we do not store any further details, nor the data sets themselves on our site.
Related
- ID: 10827
 Produced Video