A newer version of this visualization is available.
Tour of the Moon
Using elevation and image data returned by Lunar Reconnaissance Orbiter (LRO), this animation takes the viewer on a virtual tour of the Moon. The tour visits a number of interesting sites chosen to illustrate a wide variety of lunar terrain features. Some are on the near side and are familiar to both professional and amateur observers on Earth, while others can only be seen clearly from space. Some are large and old (Orientale, South Pole-Aitken), others are smaller and younger (Tycho, Aristarchus). Constantly shadowed areas near the poles are hard to photograph but easier to measure with altimetry, while several of the Apollo landing sites, all relatively near the equator, have been imaged at resolutions as high as 25 centimeters (10 inches) per pixel.
The shape of the terrain in this animation is based primarily on data from LRO's laser altimeter (LOLA), supplemented by stereo image data from its wide angle camera (LROC WAC) and from Japan's Kaguya mission. The global surface color is from Clementine.
The viewer flies over the lunar terrain, coming in for close looks at a variety of interesting sites. Color coded elevation highlights the terrain of some sites. Includes feature title and scale.
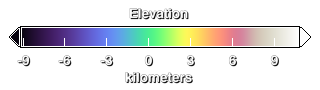
Elevation color key.
As above, but without any data overlays (color coded elevation, latitude/longitude grid at the poles, titles).

This version includes the data overlays (color coded elevation and latitude/longitude polar grid), but omits the feature name and scale.
A short segment in which the viewer flies toward the Moon from a distance. This can be added seamlessly to the start of the main tour.
Animation files that combine the short fly-in with the main tour.
A condensed version of the tour. All of the featured sites are included.
Mare Orientale. Elevation-coded color highlights the bullseye pattern of concentric rings.
The South Pole, viewed from the longitude of Orientale.
Shackleton Crater. The South Pole lies just inside this crater. Direct sunlight never reaches the crater floor. The faint crosshatch pattern is a sensor artifact.
The South Pole-Aitken Basin on the lunar far side is one of the largest and oldest impact features in the solar system. It's easily seen in the elevation data. The low center is dark blue and purple. Mountains on its edge, remnants of outer rings, are red and yellow.
Tycho Crater (center). The lighting matches that of the LROC narrow angle camera image of the central peak.
Central peak of Tycho as photographed by the LROC narrow angle camera. The boulder is about 100 meters wide.
Aristarchus Crater (bright white) and associated plateau, looking east.
Seas of Serenity (left) and Tranquility. Note the sharp color division between the two.
Taurus-Littrow Valley (large dark area, lower center), north up. The view is centered on the Apollo 17 landing site. Uses a 10-meter stereoscopic elevation map from JAXA's Kaguya spacecraft.
Apollo 17 site as photographed by the LRO narrow angle camera. Visible are the lander, rover, and trails left by both the rover tires and the astronauts.
Long shadows at the densely cratered North Pole.
Credits
Please give credit for this item to:
NASA/Goddard Space Flight Center Scientific Visualization Studio
-
Animator
- Ernie Wright (USRA)
-
Producer
- Chris Smith (HTSI)
-
Scientist
- James Garvin (NASA/GSFC)
Release date
This page was originally published on Thursday, October 27, 2011.
This page was last updated on Tuesday, November 14, 2023 at 12:01 AM EST.
Missions
This visualization is related to the following missions:Series
This visualization can be found in the following series:Datasets used in this visualization
-
[Clementine]
ID: 8 -
[LRO: LROC]
ID: 212 -
NAC (Narrow Angle Camera) [LRO: LROC]
ID: 652 -
DEM (Digital Elevation Map) [LRO: LOLA]
ID: 653 -
Kaguya Stereo DEM (DTM) [KAGUYA: LISM]
ID: 715Formerly known as "SELENE".
See all pages that use this dataset
Note: While we identify the data sets used in these visualizations, we do not store any further details, nor the data sets themselves on our site.
Newer Versions
- ID: 4619
 Visualization