United States Fire Observations and MODIS NDVI
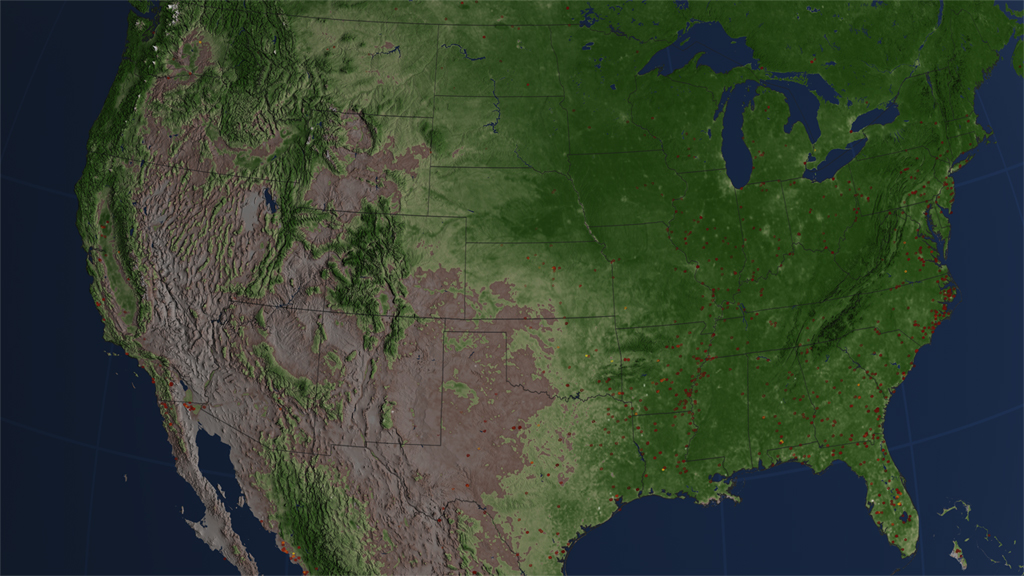
From space, we can understand fires in ways that are impossible from the ground. NASA has released a series of new visualizations that show fires detected by key fire-monitoring instruments on NASA satellites over the last decade. The visualizations show fire observations made by MODerate Resolution Imaging Spectroradiometer (MODIS) instruments on board the Terra and Aqua satellites. The visualization also includes vegetation and snow cover data to show how fires respond to seasonal changes. "It's incredibly satisfying to see such a long record of fires visualized," said Chris Justice, a scientist from the University of Maryland who leads NASA's effort to use MODIS data to study the world's fires. "It's not only exciting visually, but what you see here is a very good representation of the data scientists use to understand the global distribution of fires and to determine where and how fires are responding to climate change and population growth." North America is a region where fires are comparatively rare. North American fires make up just 2 percent of the world's burned area each year. The fires that receive the most attention in the United States, the uncontrolled forest fires in the West, are less visible than the wave of agricultural fires prominent in the Southeast and along the Mississippi River Valley, but some of the large wildfires that struck Texas earlier this spring are visible.
More information on the Fire Information for Resource Management (FIRMS) is available at http://maps.geog.umd.edu/firms/.
This animation shows fires over NDVI over the United States from July 2002 through July 2011.

Active fires and vegetation index for July 15, 2002.
Active fires and vegetation index for September 15, 2002.
Active fires and vegetation index for December 15, 2002.
Active fires and vegetation index for March 15, 2003.
Active fires and vegetation index for July 15, 2003.
Active fires and vegetation index for September 15, 2003.
Active fires and vegetation index for December 15, 2003.
Active fires and vegetation index for March 15, 2004.
Active fires and vegetation index for July 15, 2004.
Active fires and vegetation index for September 15, 2004.
Active fires and vegetation index for December 15, 2004.
Active fires and vegetation index for March 15, 2005.
Active fires and vegetation index for July 15, 2005.
Active fires and vegetation index for September 15, 2005.
Active fires and vegetation index for December 15, 2005.
Active fires and vegetation index for March 15, 2006.
Active fires and vegetation index for July 15, 2006.
Active fires and vegetation index for September 15, 2006.
Active fires and vegetation index for December 15, 2006.
Active fires and vegetation index for March 15, 2007.
Active fires and vegetation index for July 15, 2007.
Active fires and vegetation index for September 15, 2007.
Active fires and vegetation index for December 15, 2007.
Active fires and vegetation index for March 15, 2008.
Active fires and vegetation index for July 15, 2008.
Active fires and vegetation index for September 15, 2008.
Active fires and vegetation index for December 15, 2008.
Active fires and vegetation index for March 15, 2009.
Active fires and vegetation index for July 15, 2009.
Active fires and vegetation index for September 15, 2009.
Active fires and vegetation index for December 15, 2009.
Active fires and vegetation index for March 15, 2010.
Active fires and vegetation index for July 15, 2010.
Active fires and vegetation index for September 15, 2010.
Active fires and vegetation index for December 15, 2010.
Active fires and vegetation index for March 15, 2011.
Active fires and vegetation index for July 15, 2011.
Colortable showing MODIS fire pixels. The number colorized is MODIS MCD14ML T21 Brightness temperature minus the T31 Brightness temperature.
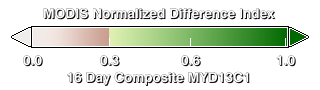
Colortable showing the MODIS MYD13C1 product of composite 16 day Normalized Difference Vegetation Index (NDVI).
Credits
Please give credit for this item to:
NASA/Goddard Space Flight Center Scientific Visualization Studio
-
Animators
- Lori Perkins (NASA/GSFC)
- Greg Shirah (NASA/GSFC)
-
Producer
- Kayvon Sharghi (USRA)
-
Scientists
- Chris Justice (University of Maryland)
- Louis Giglio (SSAI)
- Luigi Boschetti (University of Maryland College Park)
-
Writer
- Adam P Voiland (Wyle Information Systems)
Release date
This page was originally published on Tuesday, October 18, 2011.
This page was last updated on Wednesday, May 3, 2023 at 1:53 PM EDT.
Missions
This visualization is related to the following missions:Series
This visualization can be found in the following series:Datasets used in this visualization
-
Fire Location [Terra and Aqua: MODIS]
ID: 496Credit: Fire location data courtesy of MODIS Rapid Response Project (NASA/GSFC and University of Maryland - http://rapidfire.sci.gsfc.nasa.gov)
See all pages that use this dataset -
NDVI (Normalized Difference Vegetation Index (NDVI)) [Terra and Aqua: MODIS]
ID: 633
Note: While we identify the data sets used in these visualizations, we do not store any further details, nor the data sets themselves on our site.
Related
- ID: 11076
 Produced Video