South American Fire Observations and MODIS NDVI
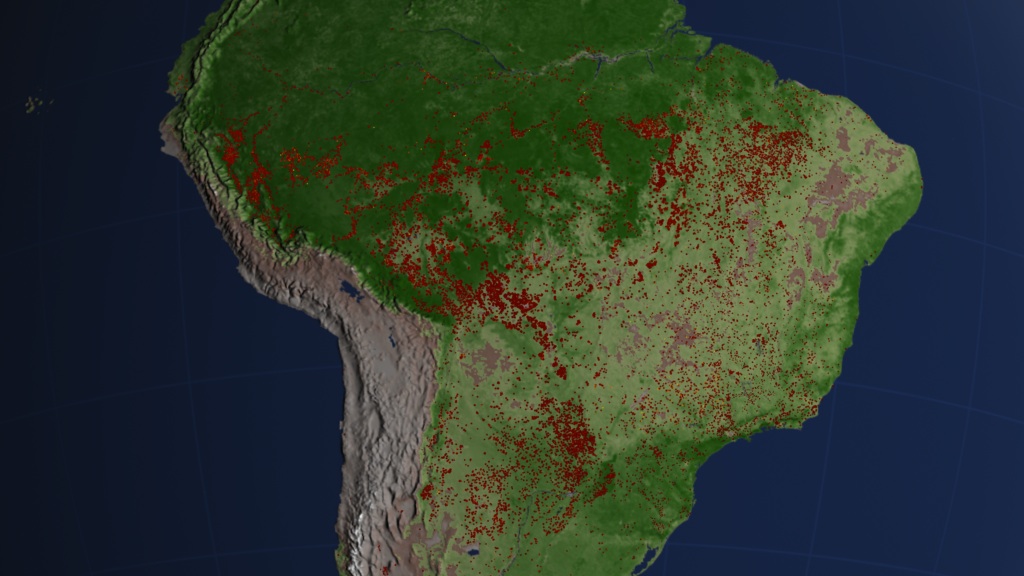
From space, we can understand fires in ways that are impossible from the ground. NASA research has contributed to much improved detection of fire for scientific purposes using satellite remote sensing and geographic information systems. This visualization of South America shows fire observations made by MODerate Resolution Imaging Spectroradiometer (MODIS) instruments on board the Terra and Aqua satellites . South America exhibits a steady flickering of fire across much of the Amazon rainforest with peaks of activity in September and November. Almost all of the fires in the Amazon are the direct result of human activity, including slash-and-burn agriculture, because the high moisture levels in the region prevent inhibit natural fires from occurring.
More information on the Fire Information for Resource Management (FIRMS) is available at http://maps.geog.umd.edu/firms/.
This animation shows fires over MODIS NDVI in South America from July 2002 through July 2011. The still image seen here is from July 15, 2007 where fires scorched more than 3 million acres. Naturally ocurring fires are not uncommon in the drier forests and grasslands of South America, but this type of intense, continent-spanning fire activity is almost certainly a product of human activities.

Active fires and vegetation index for July 15, 2002.
Active fires and vegetation index for September 15, 2002.
Active fires and vegetation index for December 15, 2002.
Active fires and vegetation index for March 15, 2003.
Active fires and vegetation index for July 15, 2003.
Active fires and vegetation index for September 15, 2003.
Active fires and vegetation index for December 15, 2003.
Active fires and vegetation index for March 15, 2004.
Active fires and vegetation index for December 15, 2004.
Active fires and vegetation index for July 15, 2004.
Active fires and vegetation index for September 15, 2004.
Active fires and vegetation index for March 15, 2005.
Active fires and vegetation index for July 15, 2005.
Active fires and vegetation index for September 15, 2005.
Active fires and vegetation index for December 15, 2005.
Active fires and vegetation index for March 15, 2006.
Active fires and vegetation index for July 15, 2006.
Active fires and vegetation index for September 15, 2006.
Active fires and vegetation index for December 15, 2006.
Active fires and vegetation index for March 15, 2007.
Active fires and vegetation index for July 15, 2007.
Active fires and vegetation index for September 15, 2007.
Active fires and vegetation index for December 15, 2007.
Active fires and vegetation index for March 15, 2008.
Active fires and vegetation index for July 15, 2008.
Active fires and vegetation index for September 15, 2008.
Active fires and vegetation index for December 15, 2008.
Active fires and vegetation index for March 15, 2009.
Active fires and vegetation index for July 15, 2009.
Active fires and vegetation index for September 15, 2009.
Active fires and vegetation index for December 15, 2009.
Active fires and vegetation index for March 15, 2010.
Active fires and vegetation index for July 15, 2010.
Active fires and vegetation index for September 15, 2010.
Active fires and vegetation index for December 15, 2010.
Active fires and vegetation index for March 15, 2011.
Active fires and vegetation index for July 15, 2011.
Colortable showing MODIS fire pixels. The number colorized is MODIS MCD14ML T21 Brightness temperature minus the T31 Brightness temperature.
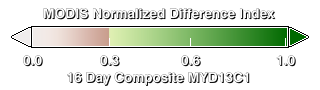
Colortable showing the MODIS MYD13C1 product of composite 16 day Normalized Difference Vegetation Index (NDVI).
Credits
Please give credit for this item to:
NASA/Goddard Space Flight Center Scientific Visualization Studio
-
Animators
- Lori Perkins (NASA/GSFC)
- Greg Shirah (NASA/GSFC)
-
Producer
- Kayvon Sharghi (USRA)
-
Scientists
- Chris Justice (University of Maryland)
- Louis Giglio (SSAI)
- Luigi Boschetti (University of Maryland College Park)
-
Writer
- Adam P Voiland (Wyle Information Systems)
Release date
This page was originally published on Tuesday, October 18, 2011.
This page was last updated on Tuesday, November 14, 2023 at 12:01 AM EST.
Missions
This visualization is related to the following missions:Series
This visualization can be found in the following series:Datasets used in this visualization
-
Fire Location [Terra and Aqua: MODIS]
ID: 496Credit: Fire location data courtesy of MODIS Rapid Response Project (NASA/GSFC and University of Maryland - http://rapidfire.sci.gsfc.nasa.gov)
See all pages that use this dataset -
NDVI (Normalized Difference Vegetation Index (NDVI)) [Terra and Aqua: MODIS]
ID: 633
Note: While we identify the data sets used in these visualizations, we do not store any further details, nor the data sets themselves on our site.
Related
- ID: 10863
 Produced Video