Aquarius Satellite & Data Pre-launch Beauty Shot
Aquarius is a focused satellite mission to measure global Sea Surface Salinity. After its planned 09-Jun-11 launch, it will provide the global view of salinity variability needed for climate studies. The Aquarius / SAC-D mission is being developed by NASA and the Space Agency of Argentina (Comision Nacional de Actividades Espaciales, CONAE). The satellite model depicted in this animation is an artist rendition and intentionally exaggerated so as to remain visible as it flies around the globe. Had the satellite model been rendered true-to-scale, it would not be visible when we pull out to see the full earth.
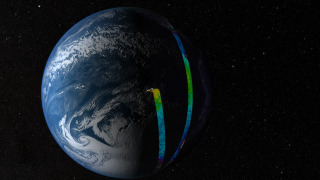
This animation is an artist depiction of the Aquarius satellite in orbit around the earth as it collects data used to derive Sea Surface Salinity (SSS) measurements. This visualization was created prior to launch and uses simulated SSS measurements. The satellite orbit and data footprint is based on predicted data in preparation for launch.

Print resolution image of Aquarius collecting data over the Indian Ocean. Earth is upsidedown with the south pole at the top of the image.
Print resolution image of Aquarius collecting data over the Pacific Ocean. The night lights of the United States and Mexico can be seen towards the upper right.
Print resolution image depicting the pattern of swaths created after three days of data collection, centered over the Pacific Ocean.
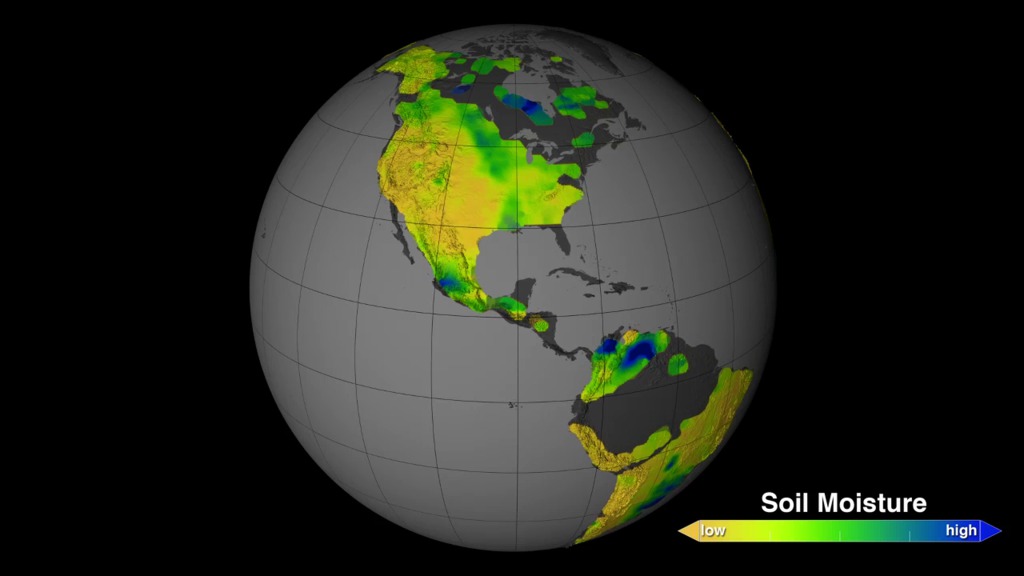
Print resolution image of simulated SSS data over the Pacific Ocean.
Credits
Please give credit for this item to:
NASA/Goddard Space Flight Center Scientific Visualization Studio
-
Animators
- Alex Kekesi (Global Science and Technology, Inc.)
- Ernie Wright (UMBC)
- Greg Shirah (NASA/GSFC)
- Chris Meaney (HTSI)
- Walt Feimer (HTSI)
-
Producer
- Brooke Harris (UMBC)
-
Scientists
- Gene Feldman (NASA/GSFC)
- Norman Kuring (NASA/GSFC)
- Fred Patt (SAIC)
- David Levine (NASA/GSFC)
- Gary Lagerloef (ESR)
-
Project support
- Shiloh Heurich (Global Science and Technology, Inc.)
- James W. Williams (Global Science and Technology, Inc.)
Release date
This page was originally published on Thursday, May 5, 2011.
This page was last updated on Wednesday, May 3, 2023 at 1:53 PM EDT.
Series
This visualization can be found in the following series:Related
- ID: 11604
 Produced Video
 - ID: 10771
 Produced Video