Solar Dynamics Observatory - Atmospheric Imaging Assembly
The Sun's activity increases as we enter solar cycle 24. But even several years away from the peak, the Sun in ultraviolet light shows a variety of activity.
This visualization consists of eight hours of SDO AIA imagery from the 30.4 nanometer filter (304 Ångstroms). This sequence plays at the full time cadence of the AIA instrument - one image every twelve seconds of real time - and showing thirty images per second on playback.
This is a movie of the active Sun as visible in the ultraviolet 30.4 nanometers wavelength. The 4096x4096 images in the Frames area are the FULL RESOLUTION SDO images with coded colors installed.
These are 4Kx4K frames with coded colors.

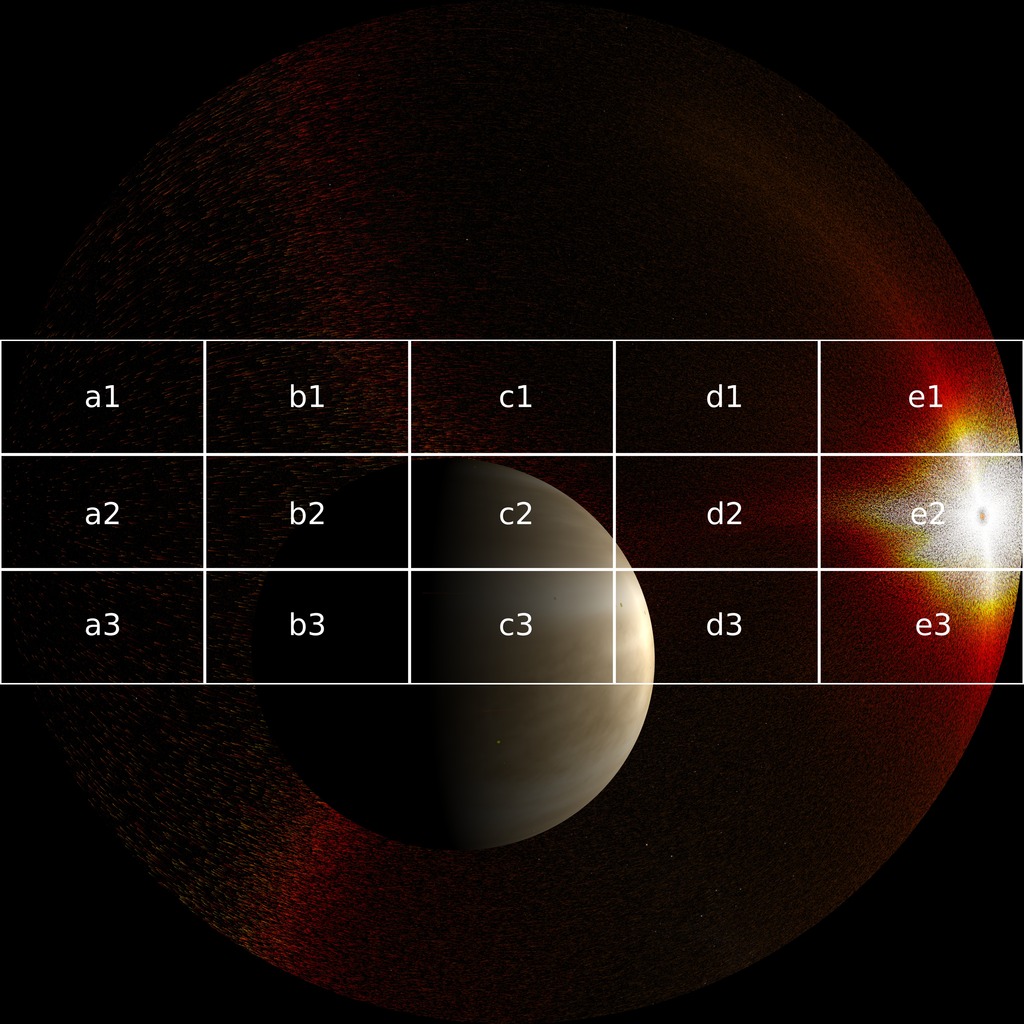
This is a set of hyperwall frames. The screens and resolution is set to show imagery at a resolution matching the hyperwall screens.
Credits
Please give credit for this item to:
NASA/Goddard Space Flight Center Scientific Visualization Studio
-
Animator
- Tom Bridgman (Global Science and Technology, Inc.)
-
Scientist
- William D. Pesnell (NASA/GSFC)
Release date
This page was originally published on Wednesday, December 7, 2011.
This page was last updated on Monday, April 22, 2024 at 5:23 PM EDT.
Missions
This visualization is related to the following missions:Series
This visualization can be found in the following series:Datasets used in this visualization
-
AIA 304 (304 Filter) [SDO: AIA]
ID: 677This dataset can be found at: http://jsoc.stanford.edu/
See all pages that use this dataset
Note: While we identify the data sets used in these visualizations, we do not store any further details, nor the data sets themselves on our site.
Related
- ID: 3867
 Visualization