LAMP Observes the LCROSS Impact
A two-ton Atlas Centaur rocket body, part of the Lunar Crater Observation and Sensing Satellite (LCROSS), struck the floor of Cabeus crater, near the south pole of the moon, at 11:31 UT on October 9, 2009. The purpose of the crash was to create a plume of debris that could be examined for the presence of water and other chemicals in the lunar regolith.
The Lyman-Alpha Mapping Project (LAMP) instrument aboard Lunar Reconnaissance Orbiter (LRO) observed the tenuous vapor cloud created by the LCROSS impact. LAMP is LRO's "night vision." Most of the time, it uses the ultraviolet light in starlight to peer into deep shadows on the moon's surface. For the LCROSS impact, LAMP was pointed just above the lunar horizon to watch for the arrival of a rapidly expanding cloud of vaporized debris from the crash.
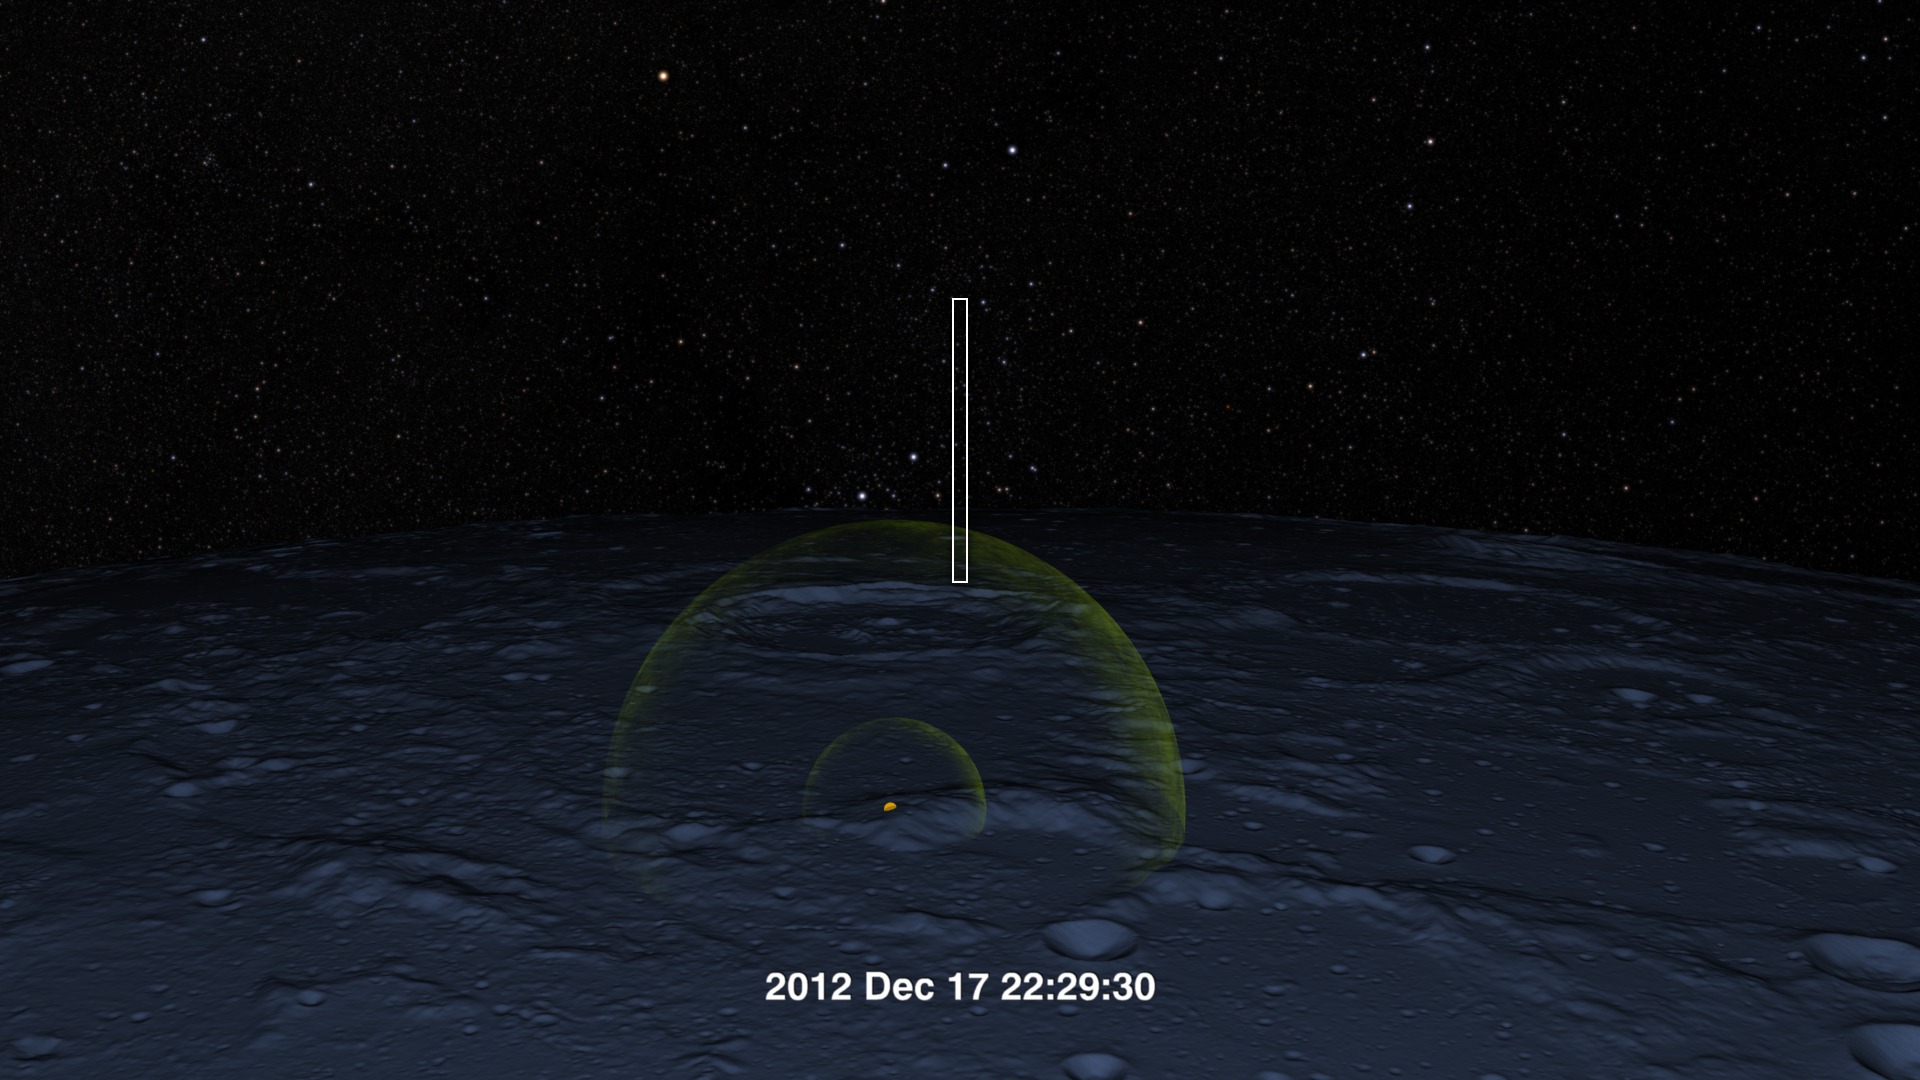
In this animation, the viewer looks down the LAMP boresight and through its narrow window. The LAMP sensor lights up as the leading edge of the expanding vapor cloud passes through its field of view. What's shown here is actually the difference between the data recorded after the LCROSS impact and that recorded on LRO's previous orbit. See this entry for more about the process of subtracting the background to enhance the LAMP signal.
The LAMP sensor slit scans the lunar horizon, lighting up as it encounters the vapor cloud created by the LCROSS impact. This version includes a date/time overlay.
The LAMP sensor slit scans the lunar horizon, lighting up as it encounters the vapor cloud created by the LCROSS impact. This version omits the date/time overlay.

Four minutes before the LCROSS impact, the view across the terrain of the lunar south pole shows LRO and LCROSS approaching the impact site, with Earth in the background.
About 40 seconds after impact, the leading edge of an expanding vapor cloud passes through LAMP's field of view.
In this version of the animation, overlays have been added comprising callouts and a graph of the LAMP sensor data that builds up over time.
Credits
Please give credit for this item to:
NASA/Goddard Space Flight Center Scientific Visualization Studio
-
Animator
- Ernie Wright (UMBC)
-
Producer
- Chris Smith (HTSI)
-
Scientist
- Randy Gladstone (SwRI)
Release date
This page was originally published on Thursday, October 21, 2010.
This page was last updated on Wednesday, May 3, 2023 at 1:54 PM EDT.
Missions
This visualization is related to the following missions:Series
This visualization can be found in the following series:Papers used in this visualization
Gladstone, G. Randall et al. (2010). LRO-LAMP observations of the LCROSS impact plume. Science, 330(6003)
Datasets used in this visualization
-
JPL/Horizon Orbital Ephemerides
ID: 597Planetary ephemerides
This dataset can be found at: http://ssd.jpl.nasa.gov/?horizons
See all pages that use this dataset -
DEM (Digital Elevation Map) [LRO: LOLA]
ID: 653 -
LRO LAMP (Lyman alpha and UV) [LRO: LAMP]
ID: 701
Note: While we identify the data sets used in these visualizations, we do not store any further details, nor the data sets themselves on our site.
Related
- ID: 4054
 Visualization