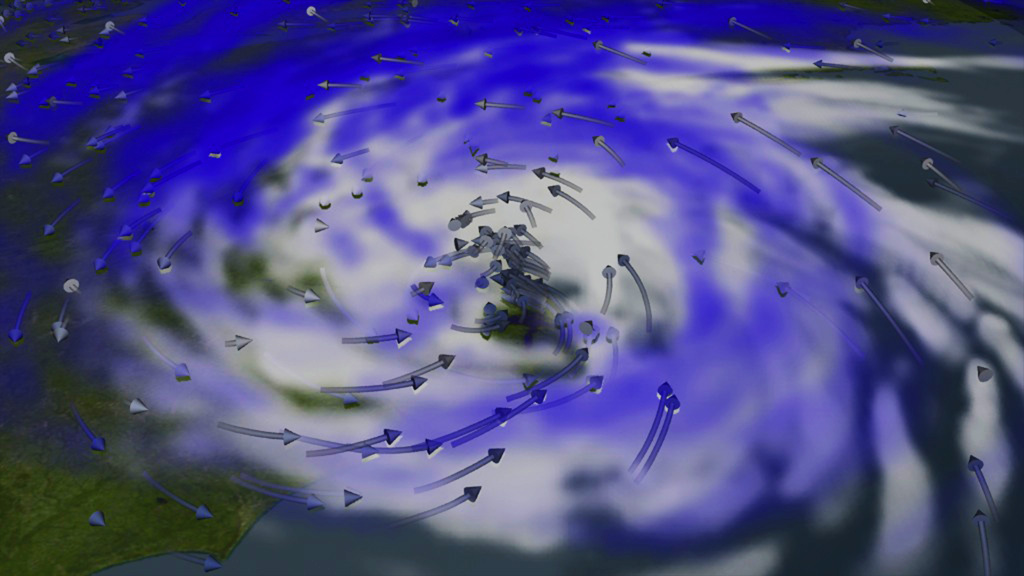
Volumetric Renderings of Hurricane Isabel based on the WRF Computational Model: close up with winds
This visualization shows cloud and ice data from an atmospheric simulation using the Weather Research and Forecasting (WRF) Model. Clouds are shown as shades of white and ice is shown as shades of blue. Cloud and ice data from the model are volumetric (with a volume size of 300x300x27 cells). Winds are represented by moving arrows. The arrows are colored from blue (lower altitudes) to white (higher altitudes). Each of these data sets were from simulations at 3. 4 km per grid cell every 5 minutes for the East coast near where Isabel made landfall.
This visualization was created in support of a video about the Climate in a Box project for the Fall 2009 American Geophysical Union (AGU) conference.
Hurricane Isabel long version (5 frames per cloud timestep)
Hurricane Isabel short version (one frame per cloud timestep)
Credits
Please give credit for this item to:
NASA/Goddard Space Flight Center Scientific Visualization Studio
The Blue Marble Next Generation data is courtesy of Reto Stockli (NASA/GSFC) and NASA's Earth Observatory.
-
Animators
- Greg Shirah (NASA/GSFC)
- Horace Mitchell (NASA/GSFC)
-
Video editor
- Victoria Weeks (HTSI)
-
Producer
- Michael Starobin (HTSI)
-
Scientist
- Tsendgar J. Lee (NASA/HQ)
Release date
This page was originally published on Friday, December 11, 2009.
This page was last updated on Sunday, November 12, 2023 at 10:01 PM EST.
Missions
This visualization is related to the following missions:Series
This visualization can be found in the following series:Datasets used in this visualization
-
BMNG (Blue Marble: Next Generation) [Terra and Aqua: MODIS]
ID: 508Credit: The Blue Marble data is courtesy of Reto Stockli (NASA/GSFC).
This dataset can be found at: http://earthobservatory.nasa.gov/Newsroom/BlueMarble/
See all pages that use this dataset -
WRF (WRF Computational Model)
ID: 664
Note: While we identify the data sets used in these visualizations, we do not store any further details, nor the data sets themselves on our site.
Related
- ID: 11009
 Produced Video