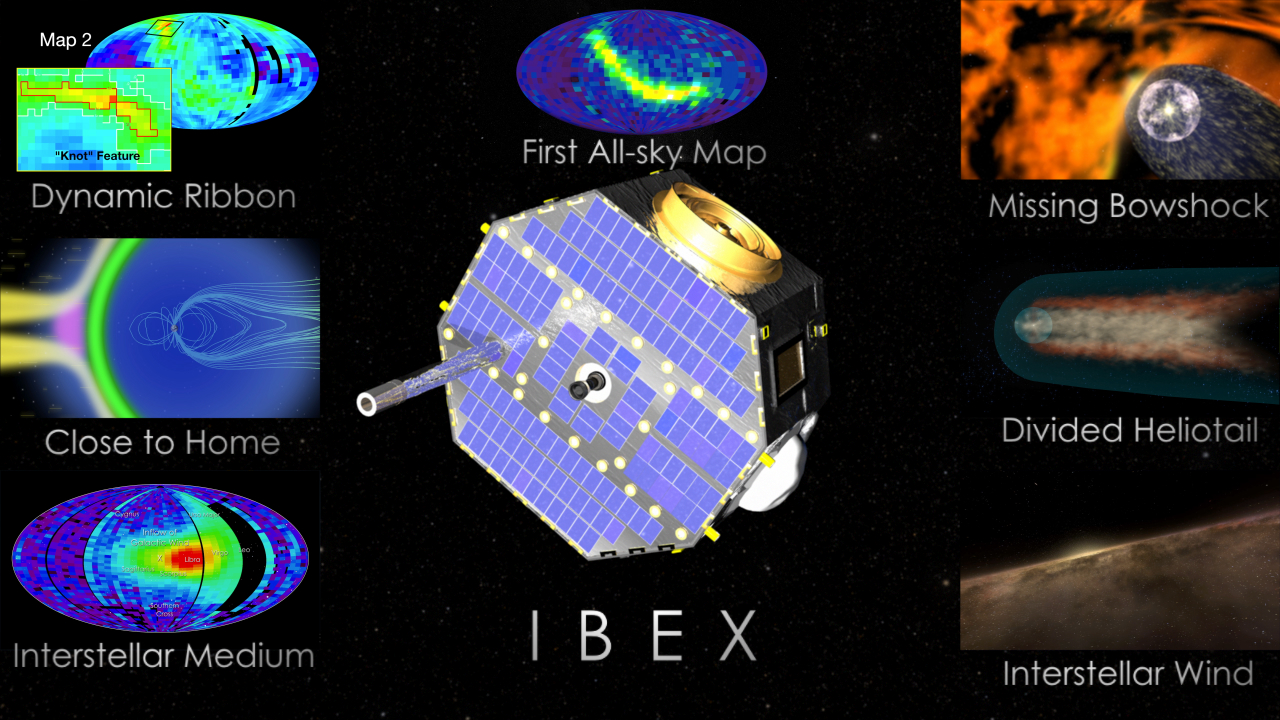
IBEX First Skymap Release
The Interstellar Boundary Explorer (IBEX) mission science team has used data from NASA's IBEX spacecraft to construct the first-ever all-sky map of the interactions occurring at the edge of the solar system, where the sun's influence diminishes and interacts with the interstellar medium. The interstellar boundary region shields our solar system from most of the dangerous galactic cosmic radiation that would otherwise enter from interstellar space.
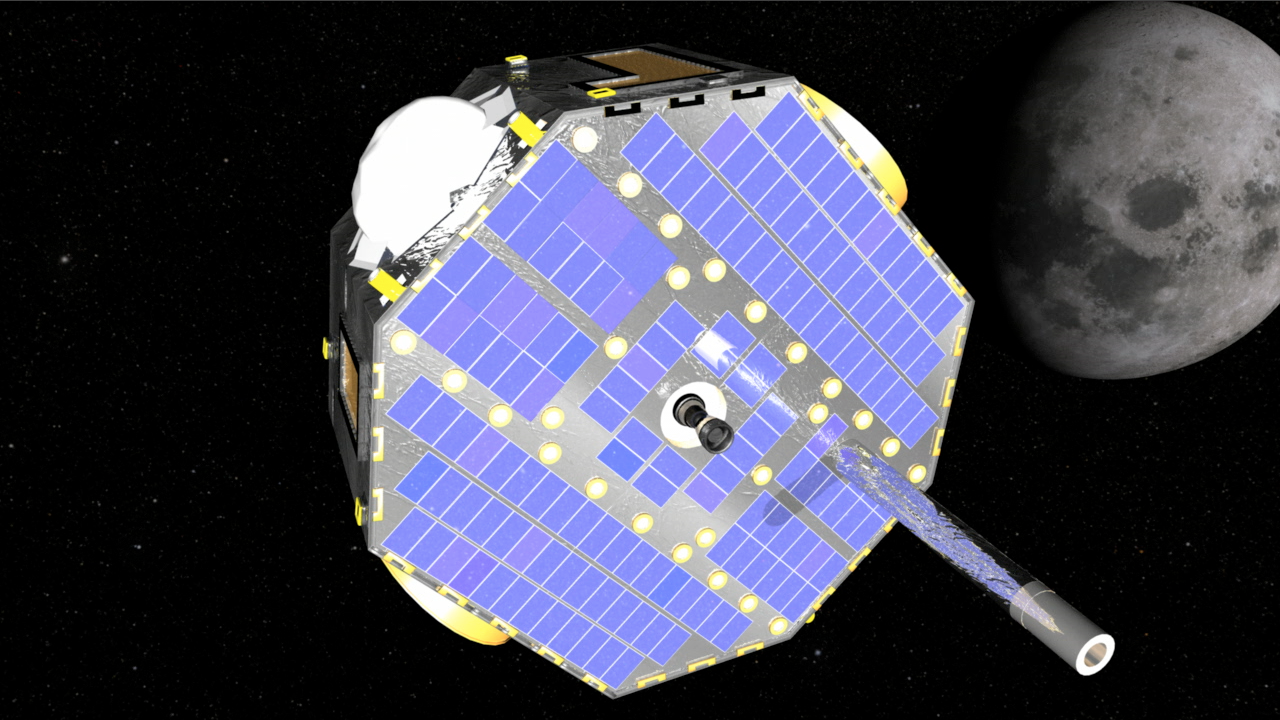
This visualization illustrates the IBEX satellite in Earth orbit (the orbit reaching almost as far as the orbit of the Moon) and pulls out to beyond the heliopause boundary (the true 3-D nature of the boundary is reduced to a 2-D spherical surface). The sphere with the skymap opens to reproject the data into a near-Aitoff type map projection.
The skymap shows the measured flux of energetic neutral atoms (ENAs).
This movie pulls out from the region of the IBEX spacecraft to beyond the heliopause, illustrating the region which is the source of the IBEX data.

The movie opens with a view looking down on the Earth, the Moon and its orbit, and the IBEX satellite.
Our view moves closer to the plane of the ecliptic (the grid) illustrating how the orbit of IBEX extends almost as far as the Moon, but is inclined relative to the lunar orbit.
Pulling back from the Earth, we see a more complete view of the IBEX orbit (green) and also fade in a path representing the orbit of the Earth (blue).
Pulling back even further from the Earth, we pass the Sun. The violet arrow represents the direction of the Sun's motion with respect to the local interstellar medium. We have now included the IBEX skymap as a semi-transparent layer (revealing the stars beyond).
Pulling back farther still, beyond the orbit of Pluto, we view the IBEX skymap in the direction of the Sun's relative motion. We also see the position of the two Voyager spacecraft.
We now pass outside the heliopause boundary. The region of emission detected by IBEX is now represented by a thin spherical shell around the Sun. In reality, the emission is probably from a much thicker region but the IBEX skymap cannot determine that scale.
We crack open the sphere projecting the IBEX skymap...
to view the map within.
We now open and distort the sphere projecting the IBEX skymap into a form similar to the Aitoff or Hammer map projection.
Colorbar for IBEX skymap. ENA = Energetic Neutral Atoms
For More Information
Credits
Please give credit for this item to:
NASA/Goddard Space Flight Center Scientific Visualization Studio
-
Animator
- Tom Bridgman (Global Science and Technology, Inc.)
-
Video editor
- Scott Wiessinger (UMBC)
-
Producer
- Silvia Stoyanova (UMBC)
-
Scientists
- Dave McComas (SwRI)
- Robert J. MacDowall (NASA/GSFC)
- Eric Christian (NASA/HQ)
-
Writer
- Laura A. Layton (RSIS)
Release date
This page was originally published on Thursday, October 15, 2009.
This page was last updated on Wednesday, May 3, 2023 at 1:54 PM EDT.
Missions
This visualization is related to the following missions:Series
This visualization can be found in the following series:Papers used in this visualization
Datasets used in this visualization
-
Tycho Catalogue (Tycho 2 Catalogue) [Hipparcos: Telescope]
ID: 550This dataset can be found at: http://archive.eso.org/ASTROM/
See all pages that use this dataset -
Differential Flux (0.9-1.5 keV) [IBEX: IBEX-Hi]
ID: 660
Note: While we identify the data sets used in these visualizations, we do not store any further details, nor the data sets themselves on our site.
Related
- ID: 13642
![Watch this video on the NASA Goddard YouTube channel.Music credits: “End of Days - Joe Mason Remix” by Connor Shambrook [BMI], Cyrus Reynolds [BMI], Flynn Hase Spence [ASCAP], Joseph Scott Mason [APRA]; “Brainstorming” by Laurent Dury [SACEM]; “Flight of the Leaf Remix” by Julie Gruss [GEMA], Laurent Dury [SAXEM]; “Ticks and Thoughts” by Laurent Dury [SACEM]; “Intimate Journey” by Laurent Vernerey [SACEM], Nicolas de Ferran [SACEM] from Universal Production MusicComplete transcript available.](/vis/a010000/a013600/a013642/13642_IBEX11years_YouTube.00214_print.jpg) Produced Video
Produced Video - ID: 11382
 Produced Video
 - ID: 10908
 Produced Video