A newer version of this visualization is available.
The Moon's South Pole in 3D via LRO/LOLA First Light Data
The Lunar Reconnaissance Oribiter (LRO) was launched on June 18, 2009. Its mission is to map the moon's surface, find safe landing sites, locate potential resources, characterize the radiation environment, and demonstrate new technology. One of the instruments on board is the Lunar Orbiter Laser Altimeter (LOLA) which measures landing site slopes, lunar surface roughness, and has begun generation of a high resolution 3D map of the Moon. The animation depicted here is the beginning of LOLA's mapping project and shows the lunar south pole through digital elevation map data collected by the LOLA instrument during the spacecraft commissioning phase. During the commissioning phase, LRO was in a highly elliptical orbit coming closer to the lunar south pole than the north pole. Furthermore, since LOLA uses laser pulses to measure the surface, the accuracy of its measurements are greatly affected by the instrument's distance to the surface. This is why there is virtually no data of the lunar north pole, and much better coverage of the south pole.
The topographic data shown here is currently processed to show at approximately 30 meters per pixel.
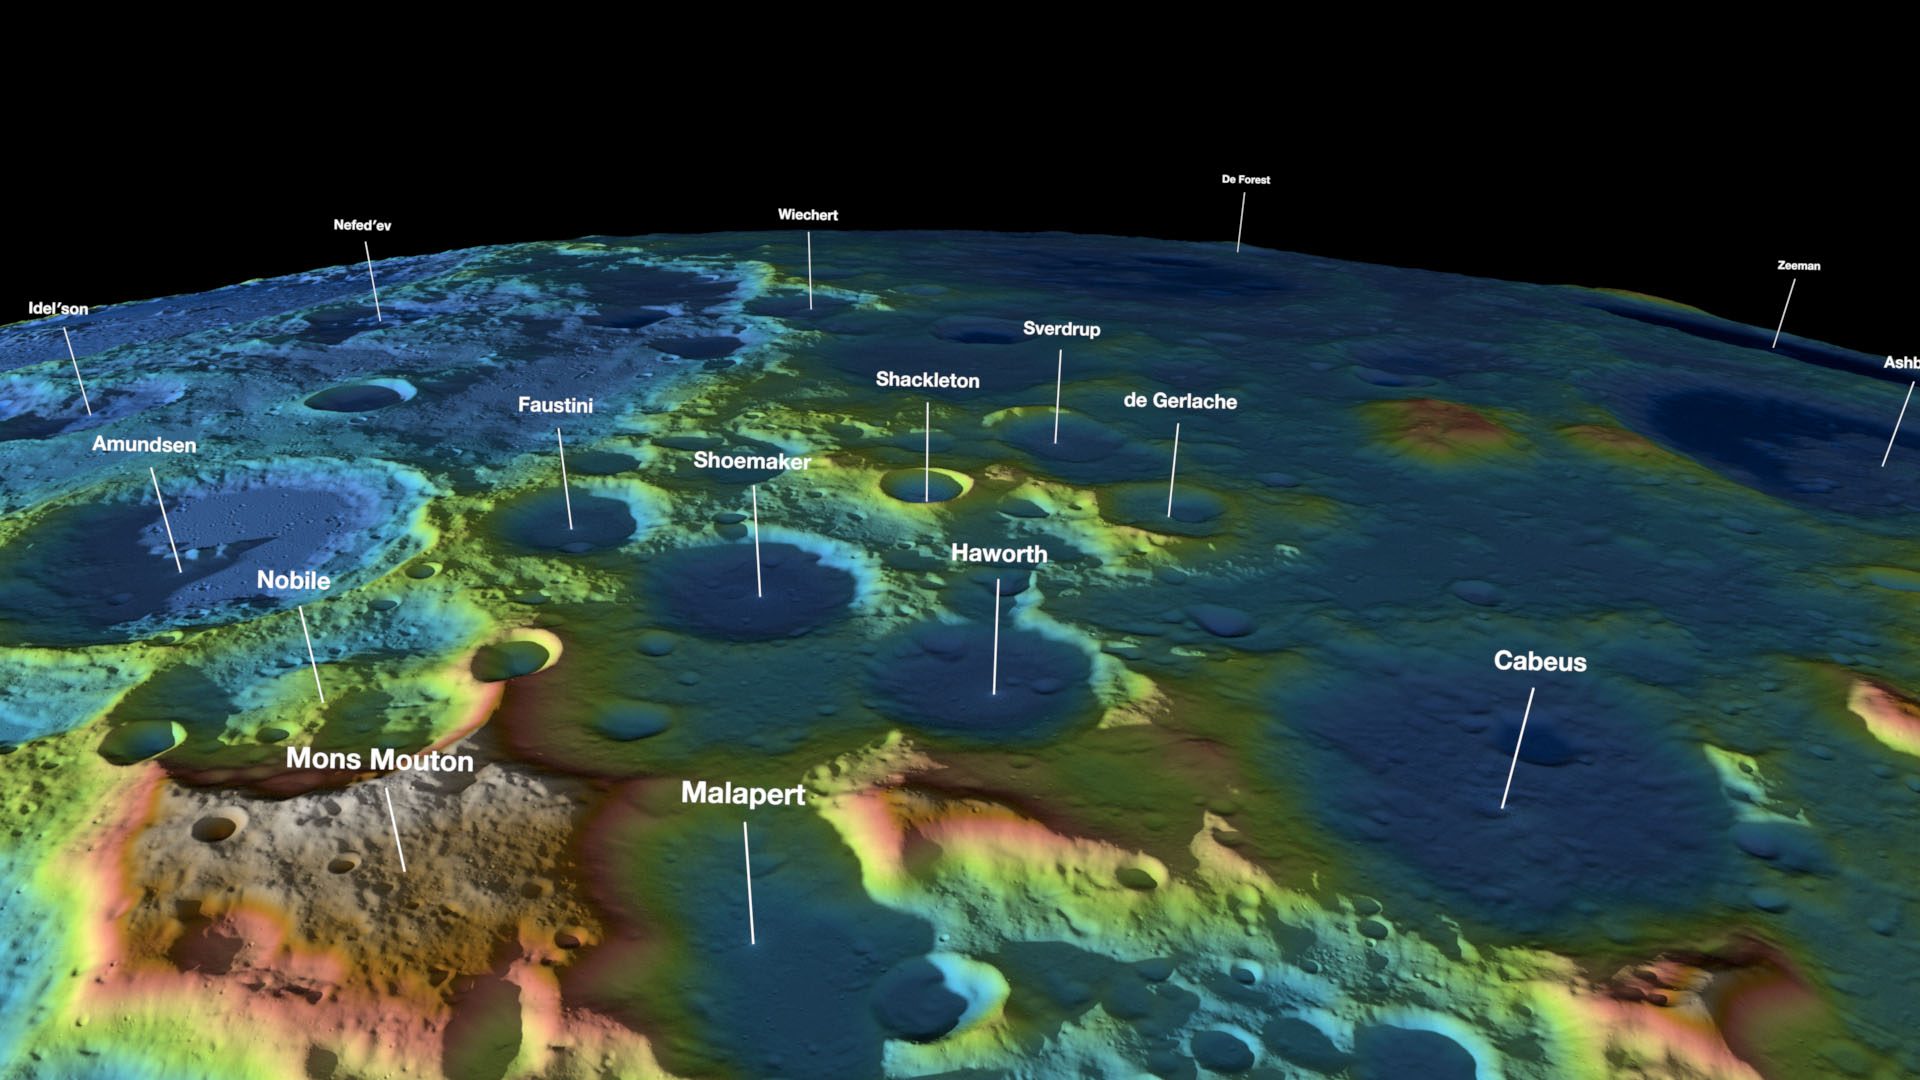
The colors in this animation depict the relative heights of the lunar surface with respect to the surface mean. Warm colors (brown, red, magenta, and tan) indicate areas above the mean. Cooler colors (green, cyan, blue, and violet) are areas below the mean.
This animation shows some of the first results of the LRO/LOLA instrument with labels over several craters. As the virtual camera flies around the lunar south pole we not only get an indication of the moon's mysterious topography at this pole, but also a sense that this mission has just begun.
This animation shows some of the first results of the LRO/LOLA instrument without any labels.
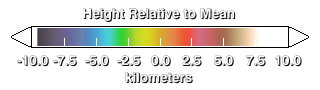
Colorbar for lunar elevations.

Print resolution still of the moon with some early swaths of LOLA data.
Print resolution still of the LRO/LOLA data swaths as they are laid out on the lunar surface. Please note that for aesthetic purposes the swath widths are shown wider than actual. The actual width of a swath is approximately 65 meters across.
Print resolution still over the lunar south pole. Craters depicted in this image are Scott, Amundsen, Faustini, Shoemaker, Haworth, Malapert, Shackleton, and Wiechert.
Print resolution still of the lunar south pole. Top down view of the south pole region.
Credits
Please give credit for this item to:
NASA/Goddard Space Flight Center Scientific Visualization Studio
-
Animators
- Alex Kekesi (Global Science and Technology, Inc.)
- Ernie Wright (UMBC)
- Greg Shirah (NASA/GSFC)
- Marte Newcombe (Global Science and Technology, Inc.)
-
Producer
- Andrew Freeberg (NASA/GSFC)
-
Scientists
- David Smith (NASA/GSFC)
- Gregory A. Neumann (NASA/GSFC)
-
Project support
- James W. Williams (Global Science and Technology, Inc.)
- Eduardo Valente (Global Science and Technology, Inc.)
Release date
This page was originally published on Wednesday, September 16, 2009.
This page was last updated on Wednesday, May 3, 2023 at 1:54 PM EDT.
Missions
This visualization is related to the following missions:Series
This visualization can be found in the following series:Datasets used in this visualization
-
750-nm Basemap [Clementine: UVVIS Camera]
ID: 545 -
DEM (Digital Elevation Map) [LRO: LOLA]
ID: 653
Note: While we identify the data sets used in these visualizations, we do not store any further details, nor the data sets themselves on our site.
Newer Versions
- ID: 5127
 Visualization
Used as a Source In
- ID: 14261
 Produced Video