A Tour of the Cryosphere 2009
The cryosphere consists of those parts of the Earth's surface where water is found in solid form, including areas of snow, sea ice, glaciers, permafrost, ice sheets, and icebergs. In these regions, surface temperatures remain below freezing for a portion of each year. Since ice and snow exist relatively close to their melting point, they frequently change from solid to liquid and back again due to fluctuations in surface temperature. Although direct measurements of the cryosphere can be difficult to obtain due to the remote locations of many of these areas, using satellite observations scientists monitor changes in the global and regional climate by observing how regions of the Earth's cryosphere shrink and expand.
This animation portrays fluctuations in the cryosphere through observations collected from a variety of satellite-based sensors. The animation begins in Antarctica, showing some unique features of the Antarctic landscape found nowhere else on earth. Ice shelves, ice streams, glaciers, and the formation of massive icebergs can be seen clearly in the flyover of the Landsat Image Mosaic of Antarctica. A time series shows the movement of iceberg B15A, an iceberg 295 kilometers in length which broke off of the Ross Ice Shelf in 2000. Moving farther along the coastline, a time series of the Larsen ice shelf shows the collapse of over 3,200 square kilometers ice since January 2002. As we depart from the Antarctic, we see the seasonal change of sea ice and how it nearly doubles the apparent area of the continent during the winter.
From Antarctica, the animation travels over South America showing glacier locations on this mostly tropical continent. We then move further north to observe daily changes in snow cover over the North American continent. The clouds show winter storms moving across the United States and Canada, leaving trails of snow cover behind. In a close-up view of the western US, we compare the difference in land cover between two years: 2003 when the region received a normal amount of snow and 2002 when little snow was accumulated. The difference in the surrounding vegetation due to the lack of spring melt water from the mountain snow pack is evident.
As the animation moves from the western US to the Arctic region, the areas affected by permafrost are visible. As time marches forward from March to September, the daily snow and sea ice recede and reveal the vast areas of permafrost surrounding the Arctic Ocean.
The animation shows a one-year cycle of Arctic sea ice followed by the mean September minimum sea ice for each year from 1979 through 2008. The superimposed graph of the area of Arctic sea ice at this minimum clearly shows the dramatic decrease in Artic sea ice over the last few years.
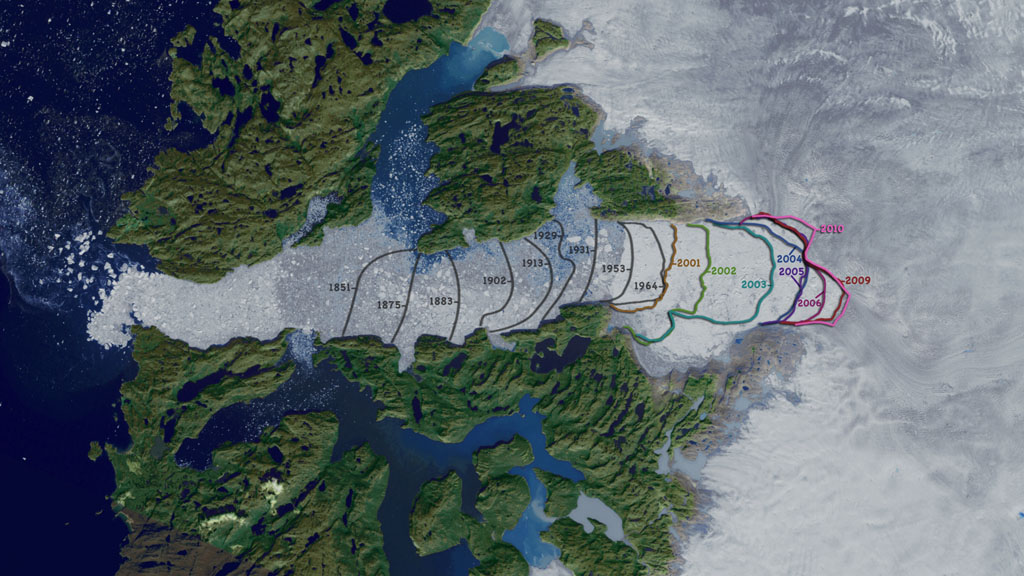
While moving from the Arctic to Greenland, the animation shows the constant motion of the Arctic polar ice using daily measures of sea ice activity. Sea ice flows from the Arctic into Baffin Bay as the seasonal ice expands southward. As we draw close to the Greenland coast, the animation shows the recent changes in the Jakobshavn glacier. Although Jakobshavn receded only slightly from 1964 to 2001, the animation shows significant recession from 2001 through 2009. As the animation pulls out from Jakobshavn, the effect of the increased flow rate of Greenland costal glaciers is shown by the thinning ice shelf regions near the Greenland coast.
This animation shows a wealth of data collected from satellite observations of the cryosphere and the impact that recent cryospheric changes are making on our planet.
For more information on the data sets used in this visualization, visit NASA's EOS DAAC website.
Note: This animation is an update of the animation 'A Short Tour of the Cryosphere', which is itself an abridged version of the animation 'A Tour of the Cryosphere'. The popularity of the earlier animations and their continuing relevance prompted us to update the datasets in parts of the animation and to remake it in high definition. In certain cases, our experiences in using the earlier work have led us to tweak the presentation of some of the material to make it clearer. Our thanks to Dr. Robert Bindschadler for suggesting and supporting this remake.
The complete narrated visualization
This video is also available on our YouTube channel.
The complete narrated visualization with annotations removed

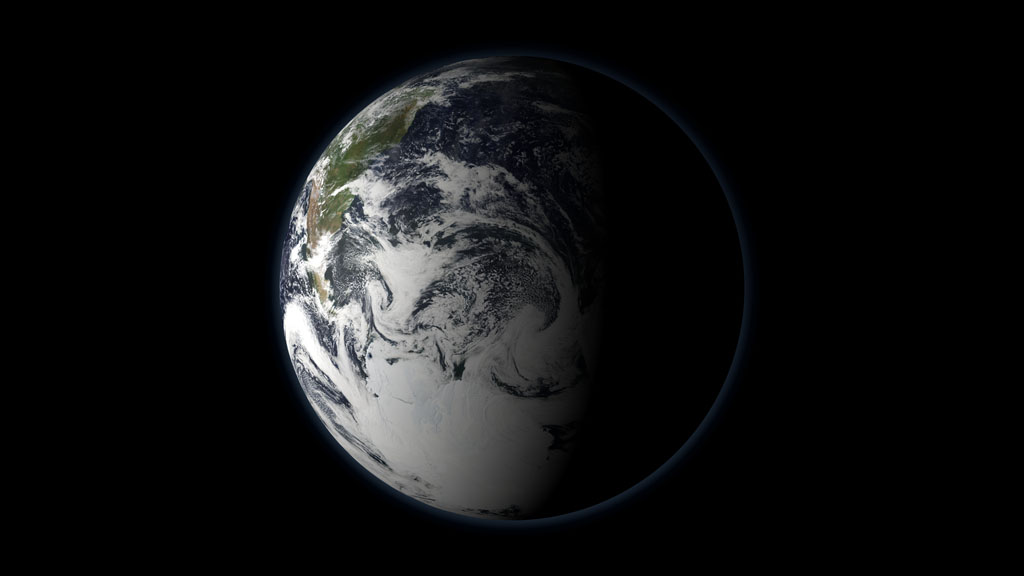
Print resolution still of the earth using MODIS imagery on March 2, 2009.
Print resolution still of Antarctica as we pass over Pine Island glacier (left of center in the picture). The Pine Island image data is taken from the MISR instrument onboard the Terra satellite on November 9, 2001. The surrounding areas are from LIMA.
Print resolution still of the Larsen-B ice shelf collapse on December 8, 2002, as shown by Landsat-7.
Print resolution still of Antarctica surrounded by sea ice. The land data is LIMA and the sea ice data is QuickSCAT/SeaWinds taken on October 10, 2004.
Print resolution still showing the locations of high altitude glaciers in the mountainous regions of South America.
Print resolution still shows the 2008 minimum sea ice concentration in the background. A chart overlay shows historical annual minumum sea ice area in the foreground.
Print resolution still shows a broad view of Greenland and the Baffin Sea on an approach to the Jakobshavn glacier, visible in the center of the image.
Print resolution still of the Jakobshavn glacier on 7/29/2009 overlain with a series of calving front lines from prior years. Lines in grey are from historical data while colored lines are obtained from satellite imagery.
In this print resolution still, shades of blue portray a reduction in the elevation of the Greenland ice sheet as measured by the ICESat satellite between 2003 and 2006.
- Atmosphere
- Copenhagen
- Cryology
- Cryosphere
- Earth Science
- Edited Feature
- Frozen Ground
- Glacier Motion/Ice Sheet Motion
- Glacier Thickness/Ice Sheet Thickness
- Glacier Topography/Ice Sheet Topography
- Glaciers
- Glaciers/Ice Sheets
- GOES
- HDTV
- Hydrosphere
- Hyperwall
- Ice Extent
- Ice Growth/Melt
- Ice Motion
- Ice Sheets
- Ice Velocity
- Narrated
- Permafrost
- precipitation
- Sea Ice
- Sea Ice Concentration
- Sea ice Motion
- snow
- Snow and Ice
- Snow Cover
- Snow/Ice
- Voice Over Talent
Credits
Please give credit for this item to:
NASA/Goddard Space Flight Center Scientific Visualization Studio
The Blue Marble Next Generation data is courtesy of Reto Stockli (NASA/GSFC) and NASA's Earth Observatory.
Historic calving front locations courtesy of Anker Weidick and Ole Bennike, Geological Survey of Denmark and Greenland
-
Animators
- Alex Kekesi (Global Science and Technology, Inc.)
- Horace Mitchell (NASA/GSFC)
- Lori Perkins (NASA/GSFC)
- Ryan Boller (NASA/GSFC)
- Greg Shirah (NASA/GSFC)
- Tom Bridgman (Global Science and Technology, Inc.)
- Marte Newcombe (Global Science and Technology, Inc.)
- Helen-Nicole Kostis (UMBC)
- Eric Sokolowsky (Global Science and Technology, Inc.)
- Randall Jones (Global Science and Technology, Inc.)
-
Visualizer
- Cindy Starr (Global Science and Technology, Inc.)
-
Video editor
- Horace Mitchell (NASA/GSFC)
-
Narrator
- Michael Starobin (HTSI)
-
Scientists
- Waleed Abdalati (NASA/GSFC)
- Bob Bindschadler (NASA/GSFC)
- Dorothy Hall (NASA/GSFC)
- Walt Meier (NSIDC)
- Richard Armstrong (University of Colorado)
- Ronald Weaver (University of Colorado)
- Mary Jo Brodzik (University of Colorado)
-
Project support
- James W. Williams (Global Science and Technology, Inc.)
- Stuart A. Snodgrass (Global Science and Technology, Inc.)
-
Writers
- Jarrett Cohen (Global Science and Technology, Inc.)
- Michael Starobin (HTSI)
Release date
This page was originally published on Tuesday, September 1, 2009.
This page was last updated on Wednesday, November 15, 2023 at 12:00 AM EST.
Missions
This visualization is related to the following missions:Series
This visualization can be found in the following series:Datasets used in this visualization
-
[GOES-8: Imager]
ID: 30 -
[QuikSCAT: SeaWinds]
ID: 85SeaWinds is a scanning dual pencil-beam Ku-band scatterometer.
This dataset can be found at: http://www.mers.byu.edu/Seawinds.html
See all pages that use this dataset -
[Terra: MISR]
ID: 115 -
Gridded Population of the World (Version 3 Beta)
ID: 272 -
GTOPO30 Topography and Bathymetry
ID: 274 -
Circum-Arctic Map of Permafrost and Ground-Ice Conditions
ID: 276This dataset can be found at: http://nsidc.org/data/docs/fgdc/ggd318_map_circumarctic/index.html
See all pages that use this dataset -
NSIDC SSMI-derived September Minimum Sea Ice Concentration
ID: 277Date: 2004
See all pages that use this dataset -
World Glacier Inventory
ID: 278 -
L1B Global Elevation Data (GLA06) [ICESat: GLAS]
ID: 326 -
Derived Velocities [RADARSAT-1: SAR]
ID: 465Credit: Additional credit goes to Canadian Space Agency, RADARSAT International Inc.
See all pages that use this dataset -
DEM [SRTM: SIR-C]
ID: 481 -
Snow Cover Daily L3 Global 0.05Deg CMG (MOD10C1) [Terra: MODIS]
ID: 504 -
BMNG (Blue Marble: Next Generation) [Terra and Aqua: MODIS]
ID: 508Credit: The Blue Marble data is courtesy of Reto Stockli (NASA/GSFC).
This dataset can be found at: http://earthobservatory.nasa.gov/Newsroom/BlueMarble/
See all pages that use this dataset -
Band Combination 3, 2, 1 [Terra: ASTER]
ID: 584This dataset can be found at: http://asterweb.jpl.nasa.gov
See all pages that use this dataset -
LIMA (Landsat Image Mosaic of Antarctica) [Landsat-7: ETM+]
ID: 599Mosaicing to avoid clouds produced a high quality, nearly cloud-free benchmark data set of Antarctica for the International Polar Year from images collected primarily during 1999-2003.
This dataset can be found at: http://lima.nasa.gov/
See all pages that use this dataset -
Sea Ice Concentration (Level 3 12.5 km Sea Ice Concentration) [Aqua: AMSR-E]
ID: 608 -
RAMP DEM (Radarsat Antarctic Mapping Project (RAMP) Digital Elevation Model (DEM))
ID: 626This dataset can be found at: http://nsidc.org/data/docs/daac/nsidc0082_ramp_dem_v2.gd.html
See all pages that use this dataset -
NDVI (Normalized Difference Vegetation Index (NDVI)) [Terra and Aqua: MODIS]
ID: 633 -
True Color (Band Combination 1, 4, 3) [Terra and Aqua: MODIS]
ID: 649 -
Calving Front Line [Landsat: TM]
ID: 704Calving front lines derived from Landsat imagery.
See all pages that use this dataset -
Calving Front Lines [Terra: ASTER]
ID: 705Calving front lines derived from Terra/ASTER imagery.
See all pages that use this dataset
Note: While we identify the data sets used in these visualizations, we do not store any further details, nor the data sets themselves on our site.
Related
- ID: 10840
 Produced Video
 - ID: 10763
 Produced Video