Pull out from Jupiter Showing Moon Orbits
NOTE: The orbital plane of the moons in these visualizations is incorrect. The Galilean moons should be aligned to Jupiter's equator.
This visualization shows jupiter and 63 of its moons. We start close in to Jupiter showing relativly fast moving inner moons that are generally in the same orbital plane including the so called 'Galilean moons': Europa, Io, Ganymede, and Callisto. Other inner moons are: Amalthea, Thebe, Adrastea, and Metis. These inner moons orbit Jupiter as fast as about every 7 hours to about every 17 days. These moons are also relativly close to Jupiter: from around 100 thousand to a couple of million kilometers away.
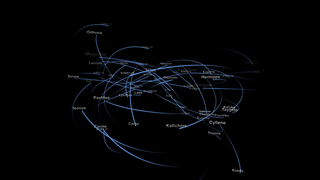
We pull back revealing many smaller moons much farther away (tens of millions of kilometers) in much longer orbits (up to several years). Time speeds up to show the motion of these moons in irregular orbits. The following outer moons are displayed: Himalia, Elara, Pasiphae, Sinope, Lysithea, Carme, Ananke, Leda, Callirrhoe, Themisto, Megaclite, Taygete, Chaldene, Harpalyke, Kalyke, Iocaste, Erinome, Isonoe, Praxidike, Autonoe, Thyone, Hermippe, Aitne, Eurydome, Euanthe, Euporie, Orthosie, Sponde, Kale, Pasithee, Hegemone, Mneme, Aoede, Thelxinoe, Arche, Kallichore, Helike, Carpo, Eukelade, Cyllene, Kore, S/2000 J11, S/2003 J2, S/2003 J3, S/2003 J4, S/2003 J5, S/2003 J9 ,S/2003 J10, S/2003 J12, S/2003 J15, S/2003 J16, S/2003 J17, S/2003 J18, S/2003 J19, and S/2003 J23.
This visualization was created in support of the Science On a Sphere film called "Largest" which is about Jupiter. The visualziation was choreographed to fit into "Largest" as a layer that is Intended to be composited with other layers including a background starfield. Three copies of this shot are arranged with orbits that fade on as we pull back in order to facilitate a seamless inset (without orbits falling off the boarder) on the Science On a Sphere composited frames.
Pullout from Jupiter showing moons

Io and Jupiter's smaller inner moons
Jupiter's Galilean moons
A swarm of Jupiter's smaller outer moons
Credits
Please give credit for this item to:
NASA/Goddard Space Flight Center Scientific Visualization Studio
-
Animators
- Greg Shirah (NASA/GSFC)
- Ernie Wright (UMBC)
- Tom Bridgman (Global Science and Technology, Inc.)
-
Video editor
- Victoria Weeks (HTSI)
-
Producer
- Michael Starobin (HTSI)
-
Scientist
- Amy A. Simon (NASA/GSFC)
Release date
This page was originally published on Monday, September 21, 2009.
This page was last updated on Wednesday, July 26, 2023 at 10:34 PM EDT.
Series
This visualization can be found in the following series:Datasets used in this visualization
-
JPL/Horizon Orbital Ephemerides
ID: 597Planetary ephemerides
This dataset can be found at: http://ssd.jpl.nasa.gov/?horizons
See all pages that use this dataset -
Cassini/Jupiter imagery [Cassini: Imaging Science Subsystem]
ID: 645Cassini/Jupiter imagery
This dataset can be found at: http://ciclops.org/
See all pages that use this dataset
Note: While we identify the data sets used in these visualizations, we do not store any further details, nor the data sets themselves on our site.
Related
- ID: 11173
 Produced Video