The Tycho Catalog Skymap - Version 2.0
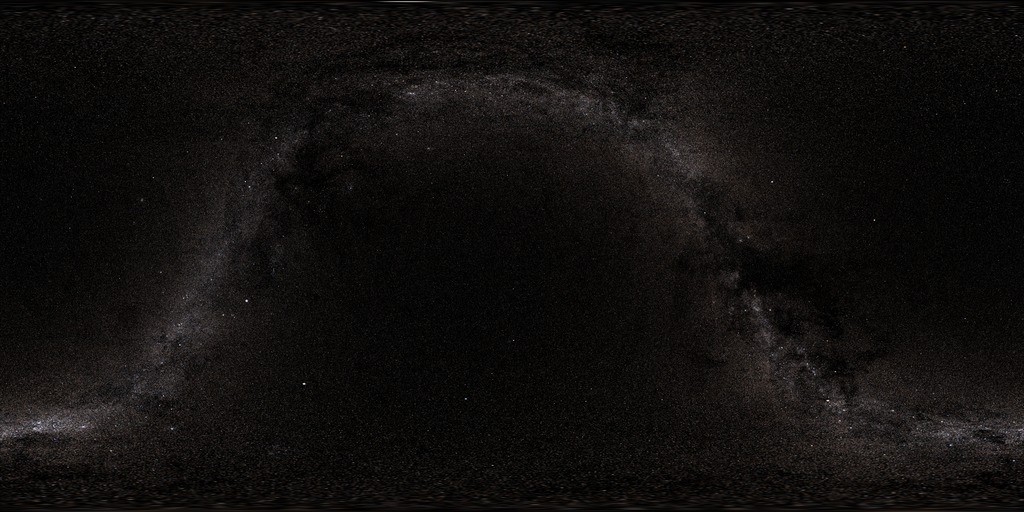
This image set is a skymap of stars from the Tycho and Hipparcos star catalogs, provided by the ESO/ECF generic catalog server. The maps are plotted in plate carrée projection (Cylindrical-Equidistant) using celestial coordinates making them suitable for mapping onto spheres in many popular animation programs.
The stars are plotted as gaussian point-spread functions (PSF) so the size and amplitude of the stars corresponds to their relative intensity. The stars are also elongated in Right Ascension (celestial longitude) based on declination (celestial latitude) so stars in the polar regions will still be round when projected on a sphere. Stars fainter than the threshold magnitude, usually selected as 5th magnitude, have their magnitude-intensity curve adjusted so they appear brighter than they really are. This makes the band of the Milky Way more visible. Stellar colors are assigned based on B and V magnitudes (B and V are stellar magnitudes measured through different filters). If Johnson B and V magnitudes are unavailable, Tycho B and V magnitudes are used instead. From these, an effective stellar temperature is derived using the algorithms described in Flower (ApJ 469, 355 1996). Corrections were noted from Siobahn Morgan (UNI). The effective temperature was then converted to CIE tristimulus X,Y,Z triples assuming a black-body emission distribution. The X,Y,Z values are then converted to red-green-blue color pixels. About 2.4 million stars are plotted, but many may be below the pixel intensity resolution. The three most conspicuously missing objects on these maps are the Andromeda galaxy (M31) and the two Magellanic Clouds.
Changes from the first version #3442, The Tycho Catalog Skymap: The star generation algorithm now favors use of the Johnson magnitudes when available. This improves the star colors over the previous method. The star intensity profiles are also slightly modified to make the cores brighter with a faster intensity falloff. We have also set the color standard to SMPTE with a gamma of 1.8.
Update: This skymap has been revised. The newer version is available at Deep Star Maps.
This movie is a sample tour of the skymap. It starts looking at the North Celestial Pole (the Little Dipper is visible). We then make short trips to the Big Dipper, the Summer Triangle (Cygnus, Lyra, and Aquila), the Orion and Taurus region, southward to Canis Major, and over to Scorpius and Saggitarius. The movie ends pointed at the South Celestial Pole (the Southern Cross is visible to the right).

A low-resolution version of the skymap. The threshold magnitude is 3.0 so the Milky Way is very faint.
A low-resolution version of the skymap. The threshold magnitude is 4.0 so the Milky Way is fainter and bright stars are smaller than the map above.
A low-resolution version of the skymap. The threshold magnitude is 5.0 so the Milky Way is very bright and bright stars are large.
These are high-resolution versions of the skymaps. They are best suited for use when you need a small field-of-view and don't want bright stars to overpower the image.
Credits
Please give credit for this item to:
NASA/Goddard Space Flight Center Scientific Visualization Studio
-
Animators
- Tom Bridgman (Global Science and Technology, Inc.)
- Ernie Wright (UMBC)
Release date
This page was originally published on Monday, January 26, 2009.
This page was last updated on Wednesday, May 3, 2023 at 1:54 PM EDT.
Series
This visualization can be found in the following series:Datasets used in this visualization
-
Hipparcos Catalogue [Hipparcos: Telescope]
ID: 549This dataset can be found at: http://www.rssd.esa.int/index.php?project=HIPPARCOS
See all pages that use this dataset -
Tycho Catalogue (Tycho 2 Catalogue) [Hipparcos: Telescope]
ID: 550This dataset can be found at: http://archive.eso.org/ASTROM/
See all pages that use this dataset
Note: While we identify the data sets used in these visualizations, we do not store any further details, nor the data sets themselves on our site.
Related
- ID: 4451
 Visualization