Hurricane Gustav Sea Surface Temperature, 8/31/08
This visualization shows Hurricane Gustav and Tropical Storm Hanna as they appeared on August 31, 2008. The colors on the ocean represent the sea surface temperatures, and satellite images of the storm clouds are laid over the temperatures to clearly show the positions of the storms. Hurricane winds are sustained by the heat energy of the ocean, so the ocean is cooled as the hurricane passes and the energy is extracted to power the winds. This cooling is shown by the blue trail in the Gulf of Mexico on the east side of Gustav. The sea surface temperature data was taken by the AMSR-E instrument on the Aqua satellite, while the cloud images were taken by the Imager on the GOES-12 satellite.

Still image of Hurricane Gustav and Tropical Storm Hanna on August 31 2008, showing the cold trail in sea surface temperature on the east side of Gustav.
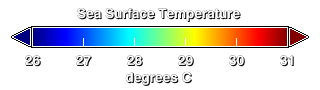
Color bar
Credits
Please give credit for this item to:
NASA/Goddard Space Flight Center Scientific Visualization Studio
-
Animator
- Trent L. Schindler (UMBC)
Release date
This page was originally published on Tuesday, September 30, 2008.
This page was last updated on Wednesday, May 3, 2023 at 1:55 PM EDT.
Datasets used in this visualization
-
[Aqua: AMSR-E]
ID: 4For more information, please click http://wwwghcc.msfc.nasa.gov/AMSR/
See all pages that use this dataset -
[GOES-12: Imager]
ID: 172
Note: While we identify the data sets used in these visualizations, we do not store any further details, nor the data sets themselves on our site.