Minimum Sea Ice Comparison: 2005, 2007 and the 1979-2007 Average
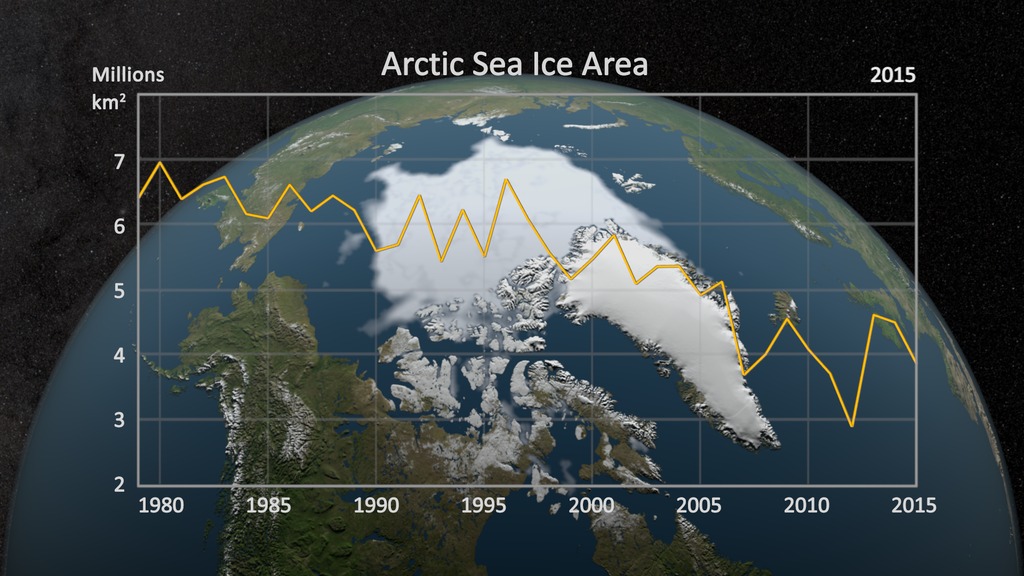
Sea ice is frozen seawater floating on the surface of the ocean. Some sea ice is semi-permanent, persisting from year to year, and some is seasonal, melting and refreezing from season to season. The sea ice cover reaches its minimum extent at the end of each summer and the remaining ice is called the perennial ice cover. The 2007 Arctic summer sea ice reached the lowest extent of perennial ice cover on record - nearly 25% less than the previous low set in 2005. The area of the perennial ice has been steadily decreasing since the satellite record began in 1979, at a rate of about 10% per decade. But the 2007 minimum, reached on September 14, is far below the previous record made in 2005 and is about 38% lower than the climatological average. Such a dramatic loss has implications for ecology, climate and industry.
A full global version of this animation was initially developed for a Science On a Sphere exhibit. A smaller subset is shown here focusing on the Arctic region. The animation is shown on a plane with a geographic (lat/lon) projection, but has been rotated 90 degrees so that the Arctic is in the center of the image. The animation compares the difference between the perennial sea ice minimum extent on September 21, 2005 and September 14, 2007. Both years are compared with the 1979-2007 average minimum sea ice.
This animation compares the 2005 annual Arctic minimum sea ice from 09/21/2005 (shown in orange) with the 2007 minimum sea ice from 09/14/2007. The average minimum sea ice from 1979 through 2007 is shown in green.

This image compares the 2007 annual Arctic minimum sea ice from 09/14/2007 with the 2005 minimum sea ice from 09/21/2005 (shown in orage). The average minimum sea ice from 1979 through 2007 is shown in green.
This image shows the above comparison without labels.
This image compares the 2007 annual Arctic minimum sea ice from 09/14/2007 with the average minimum sea ice from 1979 through 2007 (shown in green).
This image shows the above comparison without labels.
Credits
Please give credit for this item to:
NASA/Goddard Space Flight Center Scientific Visualization Studio
The Blue Marble data is courtesy of Reto Stockli (NASA/GSFC).
-
Visualizer
- Cindy Starr (Global Science and Technology, Inc.)
-
Animator
- Greg Shirah (NASA/GSFC)
-
Scientist
- Josefino Comiso (NASA/GSFC)
Release date
This page was originally published on Thursday, October 25, 2007.
This page was last updated on Wednesday, May 3, 2023 at 1:55 PM EDT.
Datasets used in this visualization
-
[DMSP: SSM/I]
ID: 11Defense Meteorological Satellite Program Special Sensor Microwave Imager
See all pages that use this dataset -
[Nimbus-7: SMMR]
ID: 78 -
Comiso's September Minimum Sea Ice Concentration
ID: 540
Note: While we identify the data sets used in these visualizations, we do not store any further details, nor the data sets themselves on our site.
Related
- ID: 4435
 Visualization