A newer version of this visualization is available.
2007 Arctic Sea Ice from AMSR-E with Alaska in Foreground
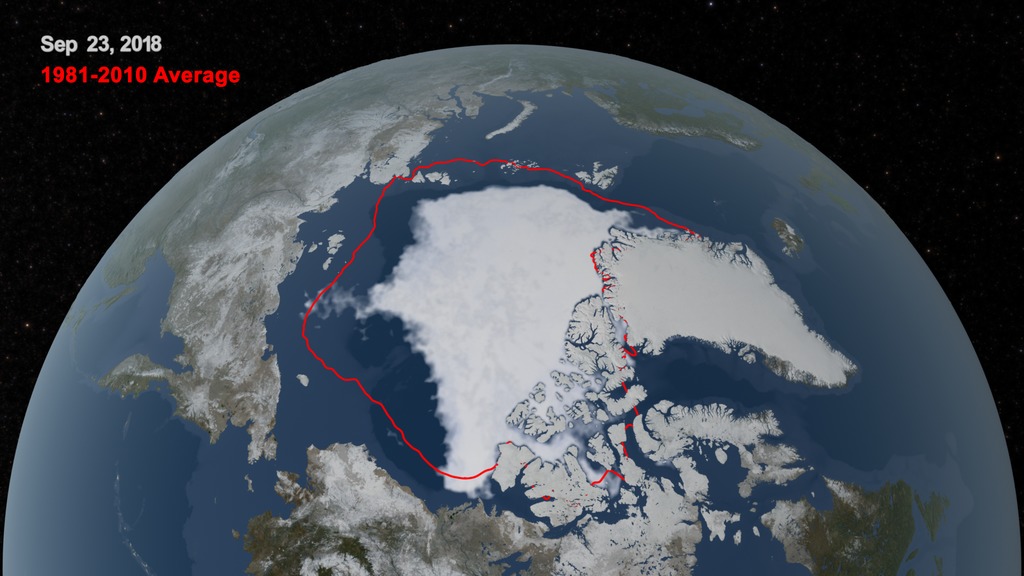
Sea ice is frozen seawater floating on the surface of the ocean. Some sea ice is semi-permanent, persisting from year to year, and some is seasonal, melting and refreezing from season to season. The sea ice cover reaches its minimum extent at the end of each summer and the remaining ice is called the perennial ice cover. The 2007 Arctic summer sea ice has reached the lowest extent of perennial ice cover on record - nearly 25% less than the previous low set in 2005. The area of the perennial ice has been steadily decreasing since the satellite record began in 1979, at a rate of about 10% per decade. But the 2007 minimum, reached on September 14, is far below the previous record made in 2005 and is about 38% lower than the climatological average. Such a dramatic loss has implications for ecology, climate and industry.
The AMSR-E instrument on the Aqua satellite acquires high resolution measurements of the 89 GHz brightness temperature near the poles. Because this is a passive microwave sensor which is not so sensitive to atmospheric effects, this sensor is able to observe the entire polar region every day, even through clouds and snowfall. This animation progresses at a rate of six frames per day from January 1, 2007 through the minimum extent which occurred on September 14, 2007. The false color of the sea ice, derived from the AMSR-E 6.25 km 89 GHz brightness temperature, highlights the fissures or divergence areas in the sea ice cover by warm brightness temperatures (in blue) while cold brightness temperatures, shown in brighter white, represent consolidated sea ice. The sea ice edge is defined by the 15% ice concentration contour in the three-day moving average of the AMSR-E 12.5 km sea ice concentration data while ice extent is the sum of all pixels with at least 15% ice.
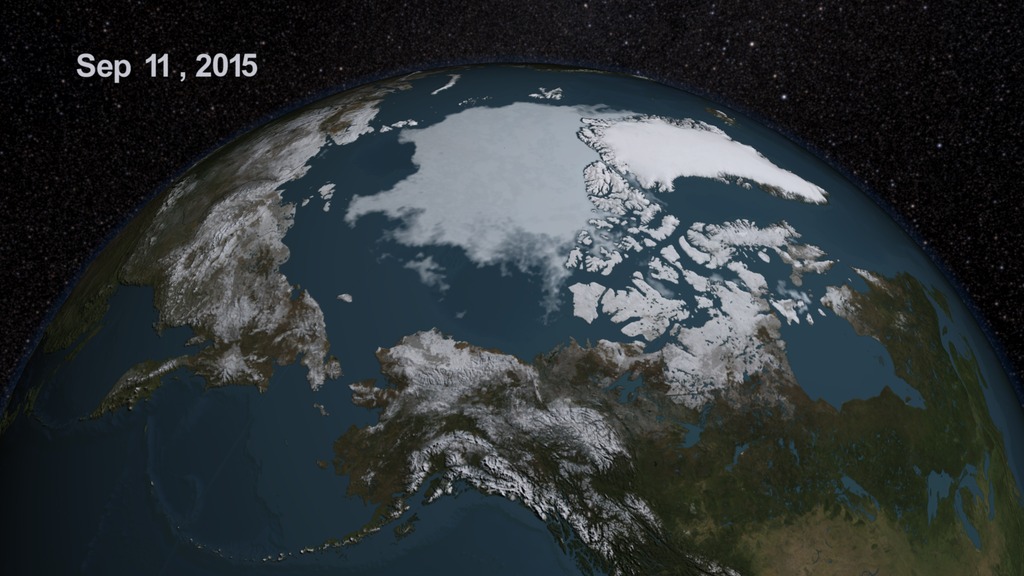
An image of the sea ice on September 14, 2007 is included below, along with a corresponding image from September 21, 2005 showing the previous minimum sea ice extent.
This animation shows the Arctic sea ices from January 1, 2007 through September 14, 2007 at a rate of 6 frames per day.

This image shows the minimum sea ice extent that occurred on September 14, 2007.
This image also shows the minimum sea ice extent that occurred on September 14, 2007. The view of this image matches the image below of the prior minimum sea ice that occurred on September 21, 2005.
This image shows the minimum sea ice that occurred on September 21, 2005. The view of this image matches the image above of the current minimum sea ice that occurred on September 14, 2007.
Credits
Please give credit for this item to:
NASA/Goddard Space Flight Center Scientific Visualization Studio
The Next Generation Blue Marble data is courtesy of Reto Stockli (NASA/GSFC).
-
Visualizer
- Cindy Starr (Global Science and Technology, Inc.)
-
Animator
- Tom Bridgman (Global Science and Technology, Inc.)
-
Scientist
- Josefino Comiso (NASA/GSFC)
Release date
This page was originally published on Tuesday, September 18, 2007.
This page was last updated on Wednesday, May 3, 2023 at 1:55 PM EDT.
Datasets used in this visualization
-
Daily L3 6.25 km 89 GHz Brightness Temperature (Tb) [Aqua: AMSR-E]
ID: 236 -
Sea Ice Concentration (Daily L3 12.5km Tb, Sea Ice Concentration, and Snow Depth) [Aqua: AMSR-E]
ID: 237
Note: While we identify the data sets used in these visualizations, we do not store any further details, nor the data sets themselves on our site.
Newer Versions
- ID: 4684
 Visualization
 - ID: 4355
 Visualization