Aqua MODIS Sea Surface Temperature Progression during Hurricane Katrina
The Aqua satellite orbits the Earth every 99 minutes in a polar, sun-synchronous orbit. The MODIS instrument on Aqua observes reflected light from the Earth in 36 spectral frequencies. These observations can be processed to show many properties of the Earth's surface, from temperature and phytoplankton measurements near the surface of the ocean to fire occurrences and land cover characteristics on the land surface.
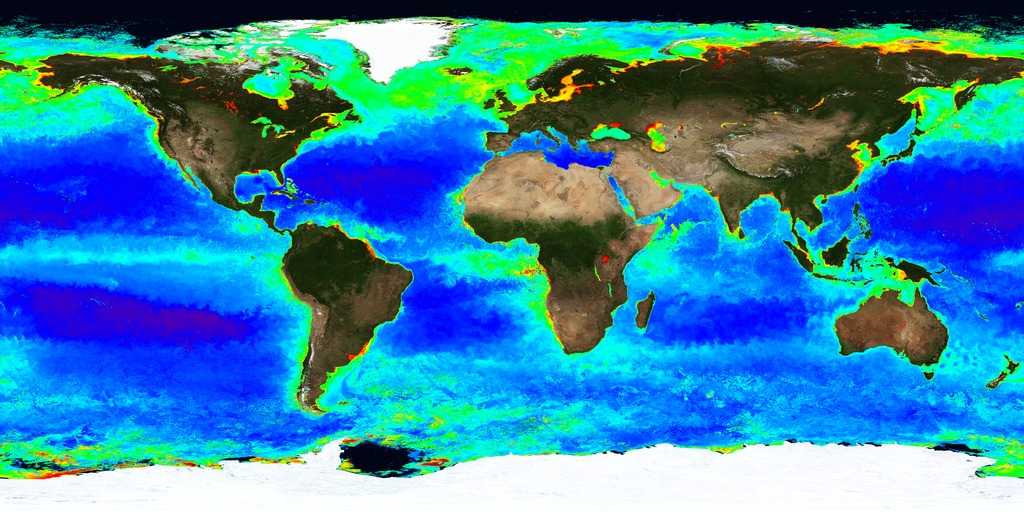
This animation shows MODIS sea surface temperature data from about 4 days of individual Aqua orbits. Sea surface temperature can only be measured by MODIS in ocean regions that are free of both clouds and sun glint, the bright band of specular reflection in the center of each granule. For this animation the data is accumulated and so builds up a complete picture of the surface of the Earth except around the South Pole, which is in darkness during the entire 4-day period.
Four days of accumulating Aqua MODIS sea surface temperature swaths during the period of Hurricane Katrina, from August 27, 2005 through August 30, 2005.
This product is available through our Web Map Service.
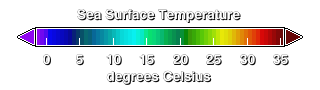
Legend for sea surface temperature measurements.
Credits
Please give credit for this item to:
NASA/Goddard Space Flight Center Scientific Visualization Studio
-
Animator
- Horace Mitchell (NASA/GSFC)
-
Scientists
- Norman Kuring (NASA/GSFC)
- Gene Feldman (NASA/GSFC)
Release date
This page was originally published on Wednesday, April 12, 2006.
This page was last updated on Sunday, November 12, 2023 at 10:00 PM EST.
Datasets used in this visualization
-
Sea Surface Temperature [Aqua: MODIS]
ID: 254
Note: While we identify the data sets used in these visualizations, we do not store any further details, nor the data sets themselves on our site.
Related
- ID: 4115
 Visualization