A newer version of this visualization is available.
Flight through the Coronal Loops
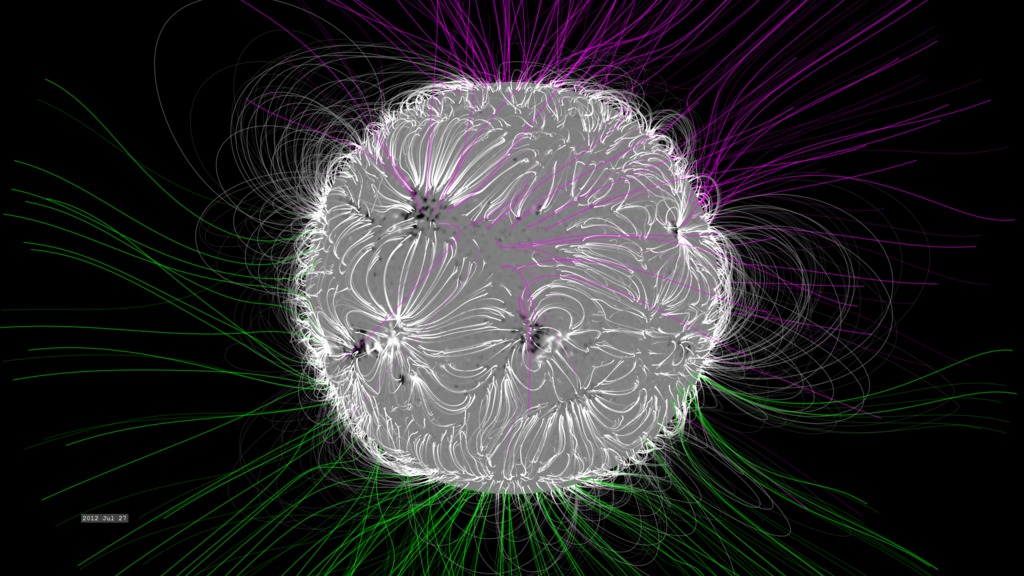
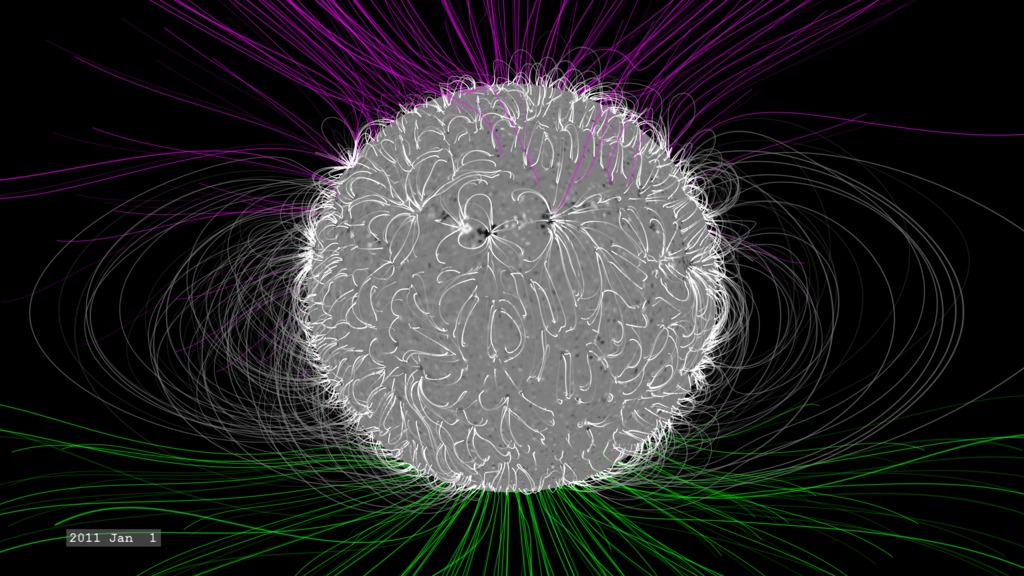
Here we illustrate the potential benefits of the 3-D views of the Sun which STEREO will provide. Starting with a simple 2-D EIT ultraviolet image from SOHO, we transition to a 3-D model and move through the coronal loops which are constructed along solar magnetic fields. The solar model is constructed from magnetogram data collected by SOHO/MDI. Because we do not see the full solar surface at any one time, the magnetograms collected over the course of a solar rotation are processed through a time-evolving solar surface model to provide a snapshot of the surface at a fixed time. The resulting magnetogram is then processed through the Potential Field Source Surface (PFSS) model. Coronal loops are visible at the higher temperatures of ultraviolet light, in this case, 195 angstroms, the filter wavelength of SOHO/EIT. For this version, we color the coronal loops green for ready comparison to the EIT 195 angstrom imagery using the EIT 'standard color table'.
Transition from a 2-D solar image to a 3-D solar model and take a flight around the Sun, close to the solar surface.
This is a stereo version of the movie. Note the stereo appearance is not that effective because of the predominant green coloration of the movie.

A 2-D view of the Sun as seen from SOHO/EIT.
A view of the coronal loops generated by the PFSS model for this time frame.
Push-in to the solar surface, focused on a small dipolar active region, AR 9731.
Rotating our view to the solar surface, we begin our flight through the upper regions of the solar atmosphere.
We continue the flight throuh the loops, moving along the same heliographic latitude.
We pass over another group of active regions.
Finally ending our tour back at AR 9731.
Credits
Please give credit for this item to:
NASA/Goddard Space Flight Center Scientific Visualization Studio
-
Animator
- Tom Bridgman (Global Science and Technology, Inc.)
-
Scientists
- Michael Kaiser (NASA/GSFC)
- Therese Kucera (NASA/GSFC)
- Don Michels (NRL)
- Russ Howard (NRL)
Release date
This page was originally published on Thursday, October 27, 2005.
This page was last updated on Wednesday, May 3, 2023 at 1:56 PM EDT.
Missions
This visualization is related to the following missions:Series
This visualization can be found in the following series:Datasets used in this visualization
-
PFSS (Magnetic Field Lines) [PFSS]
ID: 409This model generated from SOHO/MDI magnetograms through the SolarSoft package.
This dataset can be found at: http://sohowww.nascom.nasa.gov/solarsoft/
See all pages that use this dataset -
SOHO/EIT 195 (195 Filter) [SOHO: Extreme-UV Imaging Telescope (EIT)]
ID: 477This dataset can be found at: http://sohowww.nascom.nasa.gov
See all pages that use this dataset -
Magnetogram [SOHO: Michelson Doppler Interferometer (MDI)]
ID: 618This dataset can be found at: http://sohowww.nascom.nasa.gov
See all pages that use this dataset
Note: While we identify the data sets used in these visualizations, we do not store any further details, nor the data sets themselves on our site.
Newer Versions
- ID: 4623
 Visualization
 - ID: 4391
 Visualization