New-Generation Satellite Observations Monitor Air Pollution During COVID-19 Lockdown Measures in California
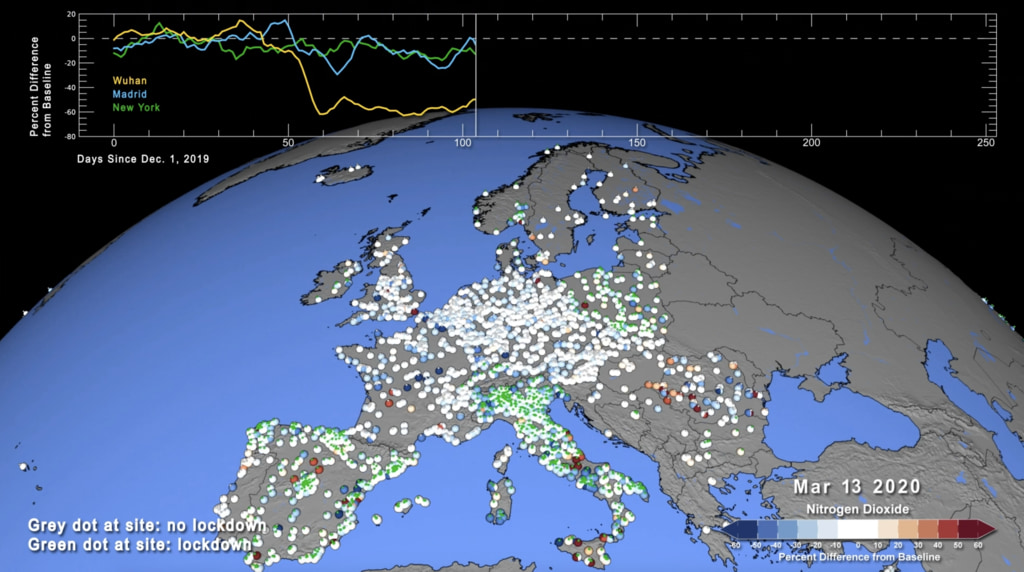
TROPOMI Nitrogen Dioxide animation.
Preventative measures adopted to reduce the rate of spread of COVID-19 in the U.S. prompted an overall slowdown in economic activity and fewer vehicles on the roadways in the spring of 2020. To examine changes in air quality in California, NASA constructed weekly averaged nitrogen dioxide (NO2) maps for March and April 2020 at 0.05° grid spacing from high-quality, cloud-free retrievals provided by Tropospheric Monitoring Instrument (TROPOMI) level 2 data.
During first weekday period (March 2-6, pre-shutdown) when COVID-19 measures were yet to be implemented, the largest tropospheric NO2 concentrations were observed in Los Angeles and bordering counties with a less prominent peak in NO2 around San Francisco. The TROPOMI scans also resolved areas of enhanced NO2 along the heavily trafficked corridor of State Route 99 (SR-99) in the Central Valley. As initial, soft COVID-19 measures were adopted by businesses in California during the second weekday period, March 9-13, TROPOMI observed strong reductions in tropospheric column NO2 around the large cities of Los Angeles and San Francisco along with noticeable decreases along SR-99. When California announced statewide “shelter-in-place” orders during the third weekday period, March 16-20, further decreases in NO2 were apparent throughout all populated areas in the state and along SR-99. Further weekly areages showed variable decreases in NO2 as decreased economic activity continued. Overall, these observed reductions in TROPOMI NO2 throughout the spring season are the result of decreased emissions on top of the seasonal changes in meteorological conditions.

TROPOMI Nitrogen Dioxide still
For More Information
Credits
Please give credit for this item to:
Copernicus Open Access Hub for access to TROPOMI L2 near real-time data. NASA Earthdata for access to TROPOMI L2 offline data, Aaron R. Naegor for generation of L3 data product
-
Scientist
- Aaron Naeger (UAH)
Release date
This page was originally published on Friday, May 8, 2020.
This page was last updated on Wednesday, November 15, 2023 at 12:44 AM EST.
Datasets used in this visualization
-
Nitrogen Dioxide [Sentinel-5p: TROPOMI]
ID: 1080Nitrogen Dioxide (NO2) Level 2 Data Product
This dataset can be found at: http://www.tropomi.eu/data-products/nitrogen-dioxide
See all pages that use this dataset
Note: While we identify the data sets used in these visualizations, we do not store any further details, nor the data sets themselves on our site.
Used as a Source In
- ID: 13753
 Produced Video