A Changing Earth at Night (Regions)

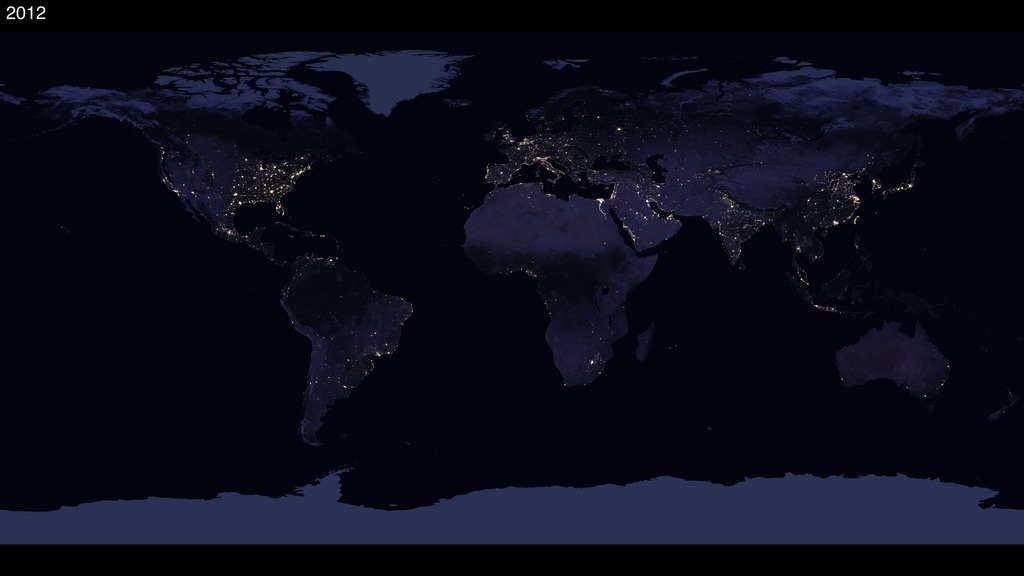
NASA’s Black Marble products are also being used by scientists and decision-makers to monitor gradual changes driven by urbanization, out-migration, economic changes, and electrification. These images show the rapid electrification of India’s rural settlements in recent years. Huge swaths of northern India, relatively dark in 2012 night shots, are lit up in NASA’s Black Marble imagery from 2016.
These images show the change in lighting intensity from 2012 to 2016 in several regions of interest. The maps were created using two separate night lights datasets (from 2012 and 2016) derived using data from the Visible Infrared Imaging Radiometer Suite (VIIRS) on the National Oceanic and Atmospheric Administration (NOAA)-NASA Suomi National Polar-orbiting Partnership (NPP) satellite. Each pixel represents 500 meters (1640 feet), or approximately six city blocks. Dark purple represents areas with new light since 2012, while dark orange represents areas where light existed in 2012 but no longer exists in 2016. Areas where lighting intensity stayed the same between 2012 and 2016 appear white. Varying shades of purple and orange indicate areas that have become brighter or dimmer since 2012, respectively.
Scientists use the Suomi NPP night lights dataset in many ways. Some applications include: forecasting a city’s energy use and carbon emissions, eradicating energy poverty and fostering sustainable energy development, providing immediate information when disasters strike, and monitoring the effects of conflict and population displacement.
In recent years, India has undergone rapid electrification (purple). In Syria, six years of war have had a devastating effect on millions of its people. One of the most catastrophic impacts has been on the country’s electricity network. Lights have gone out (orange) during the course of the conflict, leaving people to survive with little to no power. In Nigeria, light from gas flaring activity decreased from 2012 to 2016 (orange), largely due to international agreements acted on by the country. On the Korean peninsula, the border between North and South Korea is apparent. While South Korea is gleaming with city lights, North Korea has hardly any lights at all beyond a faint glimmer around Pyongyang. The light from fishing boats is also visible.
Six years of war in Syria have had a devastating effect on millions of its people. One of the most catastrophic impacts has been on the country’s electricity network. These images clearly show how the lights have gone out during the course of the conflict, leaving people to survive with little to no power. Syria was once one of the eastern Mediterranean’s major power suppliers. It has 15 power stations, including three major hydroelectric dams.
Gas flaring is a globally-used method to dispose flammable, toxic, or corrosive vapors to less-reactive compounds at oil production sites and refineries. This practice leads to significant increases of carbon emissions into the atmosphere. Gas flaring is also responsible for particulate matter, sulfur dioxide, nitrogen oxide, methane, and carcinogenic substances such as benzene and toluene. Light from gas flaring activity in Nigeria decreased from 2012 to 2016, largely due to international agreements acted on by the country.
City lights at night are a fairly reliable indicator of where people live; however, this isn’t always the case, and the Korean Peninsula shows why. As of July 2012, South Korea’s population was estimated at roughly 49 million people, and North Korea’s population was estimated at about half that number. But where South Korea is gleaming with city lights, North Korea has hardly any lights at all—just a faint glimmer around Pyongyang. Daily nighttime images are also being used to help monitor unregulated or unreported fishing. The 2012 image shows the lights of fishing boats south of the Korean Peninsula. These fishing boats disappeared in 2016.
Credits
Please give credit for this item to:
NASA's Goddard Space Flight Center
-
Scientist
- Miguel Román (NASA/GSFC)
Release date
This page was originally published on Wednesday, February 5, 2020.
This page was last updated on Wednesday, November 15, 2023 at 12:43 AM EST.
Missions
This visualization is related to the following missions:Datasets used in this visualization
-
VIIRS [Suomi NPP: VIIRS]
ID: 722
Note: While we identify the data sets used in these visualizations, we do not store any further details, nor the data sets themselves on our site.
Related
- ID: 30886
 Hyperwall Visual