Global Carbon Monoxide
Colorless, odorless, and poisonous, carbon monoxide is a major air pollutant regulated in the United States and in many other nations around the world. When carbon-based fuels, such as coal, wood, and oil burn, they produce carbon monoxide.
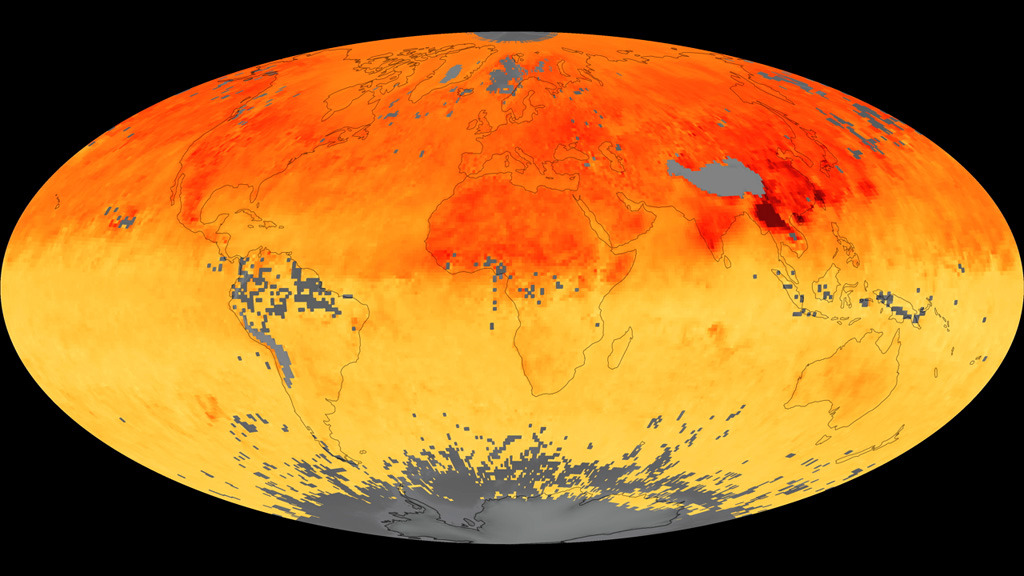
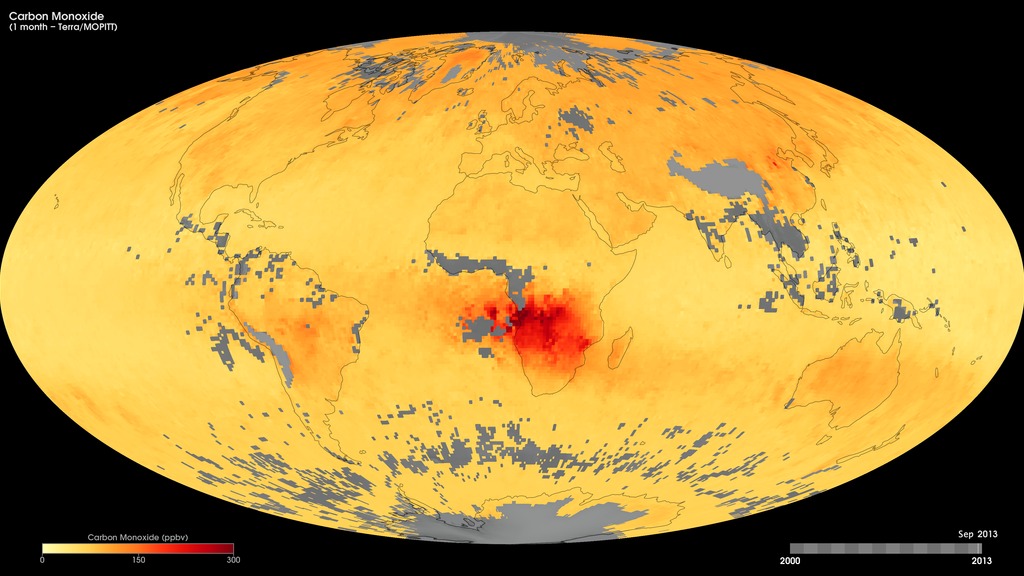
These maps show monthly averages of carbon monoxide from March 2000 to the present, as derived using data from the Measurements Of Pollution In The Troposphere (MOPITT) sensor on NASA's Terra satellite. Surface concentrations of carbon monoxide are expressed in parts per billion by volume (ppbv). A concentration of 1 ppbv means that for every billion molecules of gas in the measured volume, one of them is a carbon monoxide molecule. Total column carbon monoxide is expressed in number of molecules (times 10^18) per centimeter squared. A total column amount of 1 means that the total amount of carbon monoxide in a vertical column from the top of the atmosphere to the surface is 10^18 molecules per square centimeter.
In these maps, yellow areas have little or no carbon monoxide, while progressively higher concentrations are shown in orange, red, and dark red.
Surface Carbon Monoxide
Total Carbon Monoxide
For More Information
Credits
Please give credit for this item to:
NASA's Goddard Space Flight Center
-
Visualizer
Release date
This page was originally published on Thursday, November 28, 2019.
This page was last updated on Wednesday, November 15, 2023 at 12:42 AM EST.
Missions
This visualization is related to the following missions:Datasets used in this visualization
-
CO Mixing Ratio [Terra: MOPITT]
ID: 506 -
CO Total Column [Terra: MOPITT]
ID: 1062Level 3 monthly product MOP03JM
See all pages that use this dataset
Note: While we identify the data sets used in these visualizations, we do not store any further details, nor the data sets themselves on our site.
Related
- ID: 11836
 Produced Video
Older Versions
- ID: 30391
 Hyperwall Visual