A newer version of this visualization is available.
GRACE measures California water
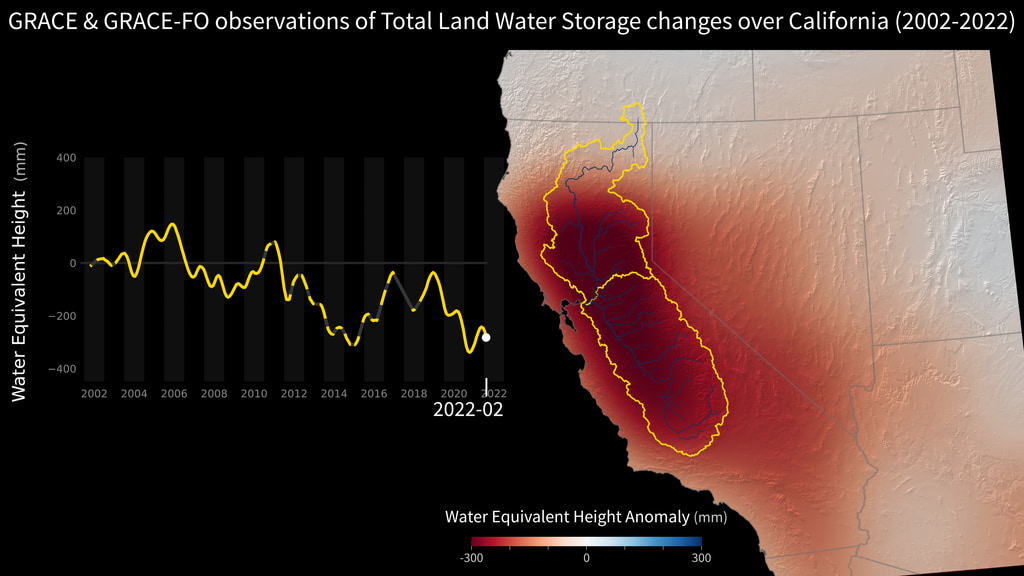
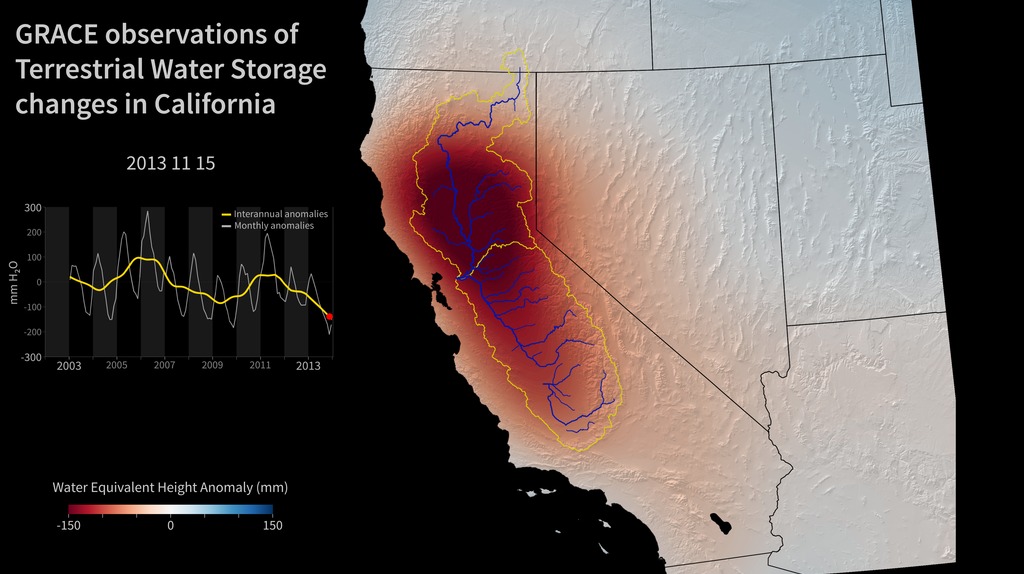
Water storage from 2002-2017 as measured by gravity anomalies.
NASA’s Gravity Recovery and Climate Experiment (GRACE) mission, launched in 2002, maps changes in Earth's gravity field resulting from the movement of water over the planet. This animation shows how the total amount of water (snow, surface water, soil moisture, and groundwater) varies in space and time, with the passage of dry seasons and wet seasons as well as with flooding, drought, and transport due to water management. Blue colors represent wetter than average conditions (relative to 2002-2017), while red colors represent drier than average conditions. The yellow line in the graph at left shows the interannual variation for area outlined in ywllow on the map, while the fainter gray line in the graph shows variations with the seasonal cycle included.
The Sacramento and San Joaquin River basins are outlined in yellow and rivers and tributaries are shown as blue lines. The basins include California's Central Valley, the most productive agricultural region in the U.S. Drought in California had drained the state of nearly 15 cubic kilometers (12 million acre feet; 4 trillion gallons) of water in 2010-2013, but a more normal 2016 and an even wetter 2017 hvae allowed some recovery along with extensive flooding.
Water storage visualization on a white background.
For More Information
Credits
Please give credit for this item to:
NASA's Goddard Space Flight Center
-
Scientist
- Felix W. Landerer (NASA/JPL CalTech)
-
Producer
- Felix W. Landerer (NASA/JPL CalTech)
-
Animator
Release date
This page was originally published on Tuesday, March 7, 2017.
This page was last updated on Tuesday, November 14, 2023 at 12:34 AM EST.
Missions
This visualization is related to the following missions:Datasets used in this visualization
-
TWS Anomaly (Terrestrial Water Storage Anomaly) [Gravity Recovery and Climate Experiment (GRACE)]
ID: 889
Note: While we identify the data sets used in these visualizations, we do not store any further details, nor the data sets themselves on our site.
Newer Versions
- ID: 31177
 Hyperwall Visual
Older Versions
- ID: 30521
 Hyperwall Visual