Sea Surface Temperature and Temperature Anomaly 2015-2016
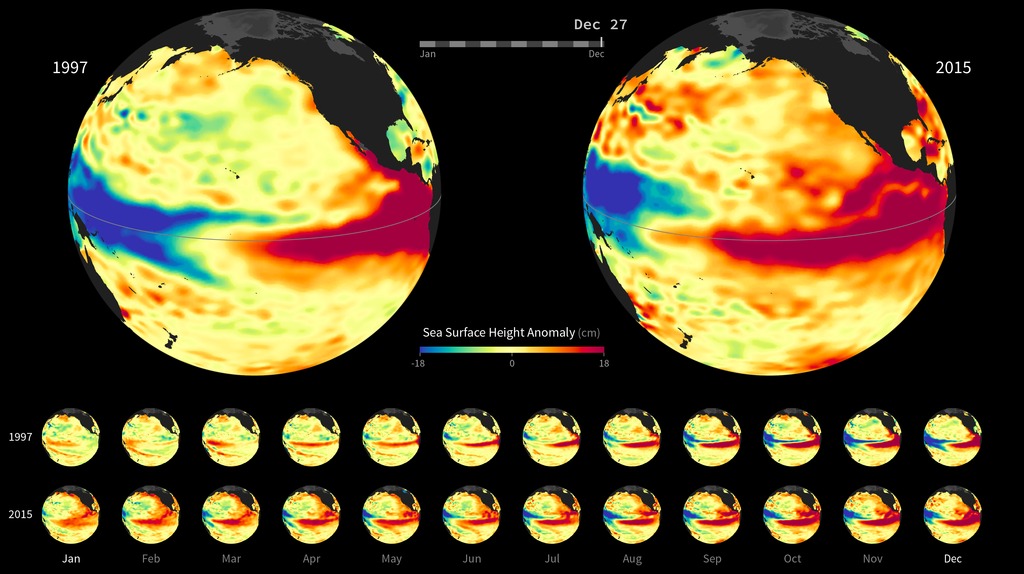
El Niño is characterized by unusually warm ocean temperatures in the eastern equatorial Pacific. Sea surface temperature is the temperature of the top millimeter of the ocean's surface. A sea surface temperature anomaly (SSTA) represents how different the ocean temperature, at a particular location and time, is from the normal (or average) temperature for that place and time.
These maps, showing sea surface temperature and sea surface temperature anomalies, reveal the progression of the strong 2015-16 El Nino event from January 1, 2015 to January 2, 2016. The sea surface temperature data are seven-day averages calculated using daily thermal data from the Moderate Resolution Imaging Spectroradiometer (MODIS) instrument. Missing data have been filled with monthly-average data. The sea surface temperature anomaly data are seven-day averages calculated using the 5-kilometer Coral Reef Watch product produced by the National Oceanic and Atmospheric Administration. The data are based on observations from geostationary and polar-orbiting satellites.
Sea Surface Temperature compared to Sea Surface Temperature Anomaly
A perspective view of SST and SSTA centered on the Pacific
For More Information
See the following sources:
Credits
Please give credit for this item to:
NASA
Generated using SST data from MODIS and SSTA data from NOAA's Coral Reef Watch
Reef Watch
Generated using AVISO Products
-
Visualizer
Release date
This page was originally published on Monday, February 1, 2016.
This page was last updated on Tuesday, November 14, 2023 at 12:31 AM EST.
Missions
This visualization is related to the following missions:Datasets used in this visualization
-
Sea Surface Temperature [Aqua: MODIS]
ID: 254 -
NOAA Coral Reef Watch (Daily 5-km Satellite Coral Bleaching Thermal Stress Monitoring SST Anomaly)
ID: 915This dataset can be found at: http://coralreefwatch.noaa.gov/satellite/bleaching5km/index.php
See all pages that use this dataset
Note: While we identify the data sets used in these visualizations, we do not store any further details, nor the data sets themselves on our site.
Related
- ID: 30629
 Hyperwall Visual
Used as a Source In
- ID: 14043
 Produced Video