El Niño Watch 2015
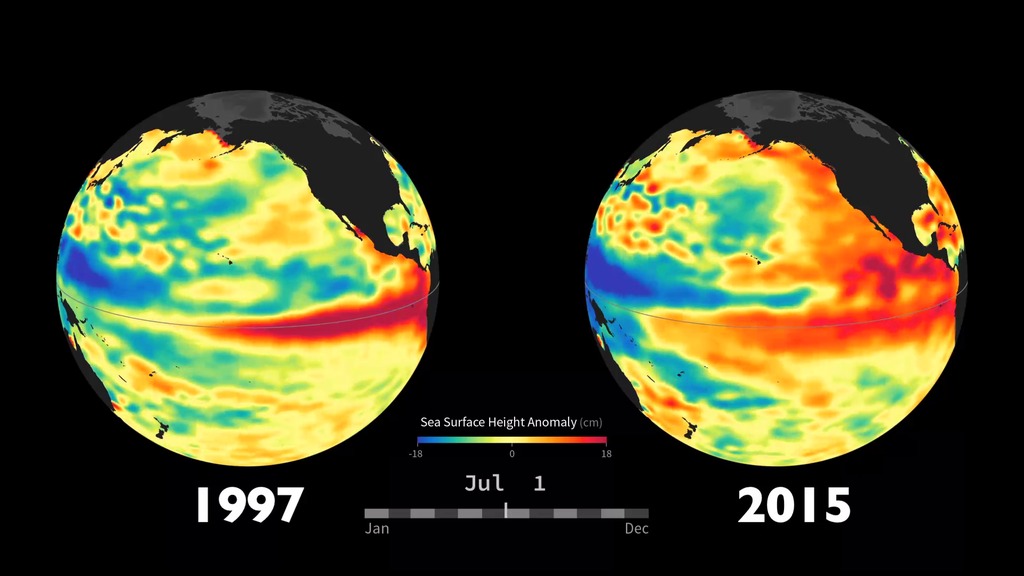
Animation of Sea Surface Height Anomaly for 2015 compared to 1997
Interest in the 2015-16 El Niño is high, as the strength of the event will influence how much rain and snowfall states like California receive this winter. Strong El Niño conditions typically result in wetter weather patterns along the United States west coast, which could help to ameliorate the ongoing drought. A statement issued by the National Oceanic and Atmospheric Administration (NOAA) Climate Prediction Center on December 10, 2015, states that "El Niño is expected to remain strong through the Northern Hemisphere winter 2015-16, with a transition to ENSO-neutral anticipated during late spring or early summer 2016."
El Niño is characterized by unusually warm ocean temperatures in the eastern equatorial Pacific. Conditions in 2015 bear some similarities to those of 1997, a year that brought one of the most potent El Niño events of the twentieth century. This visualization provides side-by-side comparisons of Pacific Ocean sea surface height anomalies (SSHA) in 2015 [right] with SSHA during the famous 1997 El Niño [left]. Red shades indicate where the ocean stood above normal sea level because warmer water expands to fill more volume (thermal expansion). Blue shades indicate where sea level and temperatures were lower than average (thermal contraction). Normal sea-level conditions appear yellow. The maps—based on altimetry data collected by the TOPEX/Poseidon (1997) and OSTM/Jason-2 (2015) satellites—have been processed to highlight the interannual signal of SSH, i.e., the mean signal, seasonal signal, and the trend have been removed.

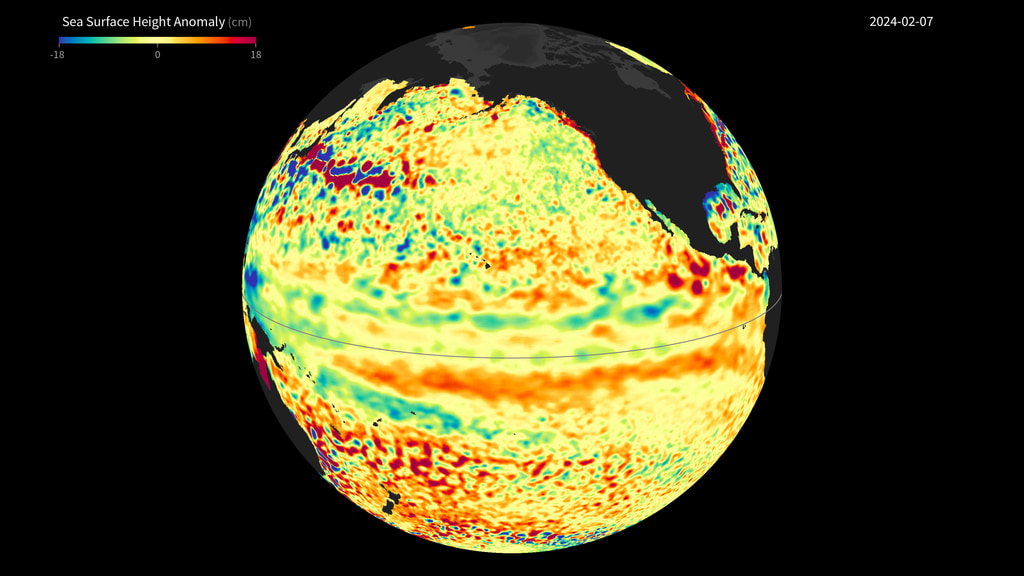
Most recent image comparing SSHA in 2015 and 1997
For More Information
Credits
Please give credit for this item to:
NASA/JPL OSTM/Jason-2, based on products provided by Akiko Hayashi and Bill Patzert, NASA/JPL Ocean Surface Topography Team.
-
Visualizer
Release date
This page was originally published on Sunday, December 27, 2015.
This page was last updated on Sunday, March 3, 2024 at 12:26 AM EST.
Missions
This visualization is related to the following missions:Datasets used in this visualization
-
Sea Surface Height Anomaly [TOPEX: Poseidon]
ID: 514 -
SSHA (Sea Surface Height Anomaly) [OSTM/Jason-2: Poseidon-3]
ID: 891
Note: While we identify the data sets used in these visualizations, we do not store any further details, nor the data sets themselves on our site.
Related
- ID: 31232
 Hyperwall Visual
 - ID: 30748
 Hyperwall Visual
 - ID: 11997