AXIOM-1 Sea Surface Salinity, Sea Ice Thickness and Atmospheric Precipitable Water
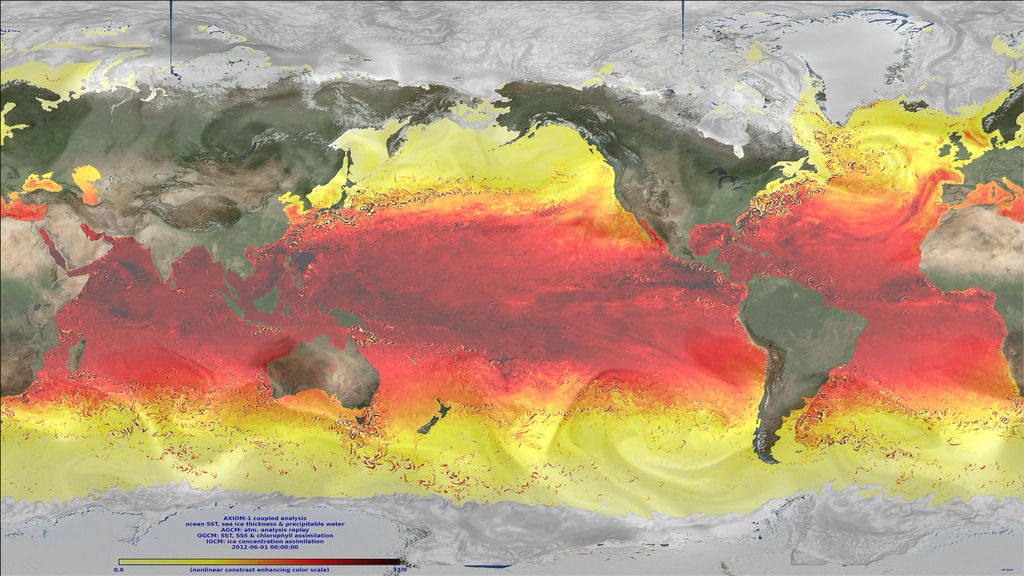
This animation shows sea surface sailinity, sea ice thickness, and atmospheric precipitable water.
AXIOM-1 (eXperimental Analysis of sea Ice and Ocean Mesoscale version 1) is a coupled analysis of the global ocean and sea ice obtained by assimilating Aquarius sea surface salinity (SSS) and MODIS chlorophyll data together with sea surface temperature (SST) and sea ice concentrations from the OSTIA objective analysis into a global high-resolution coupled ocean/ atmosphere/sea ice model. The coupled model components are the MOM-5 ocean general circulation model, the GEOS-5 atmospheric general circulation model and the CICE sea ice model. The ocean and sea ice model horizontal resolutions vary from 11km to less than 3km in the Arctic and the atmospheric model resolution is the same as that used to produce the GMAO operational weather forecasts (25km).
As a preamble to a fully coupled integrated earth system analysis, the atmospheric model is constrained to the GMAO MERRA-2 atmospheric reanalysis (prior to June 2013) and to the GMAO operational forward processing stream (after June 2013) while the SST, SSS, ice concentration and chlorophyll data are assimilated into the coupled model using a new methodology [State Adaptive Forecast-error Estimation (SAFE): https://gmao.gsfc.nasa.gov/pubs/docs/Keppenne721.pdf] developed especially for high-resolution data assimilation.
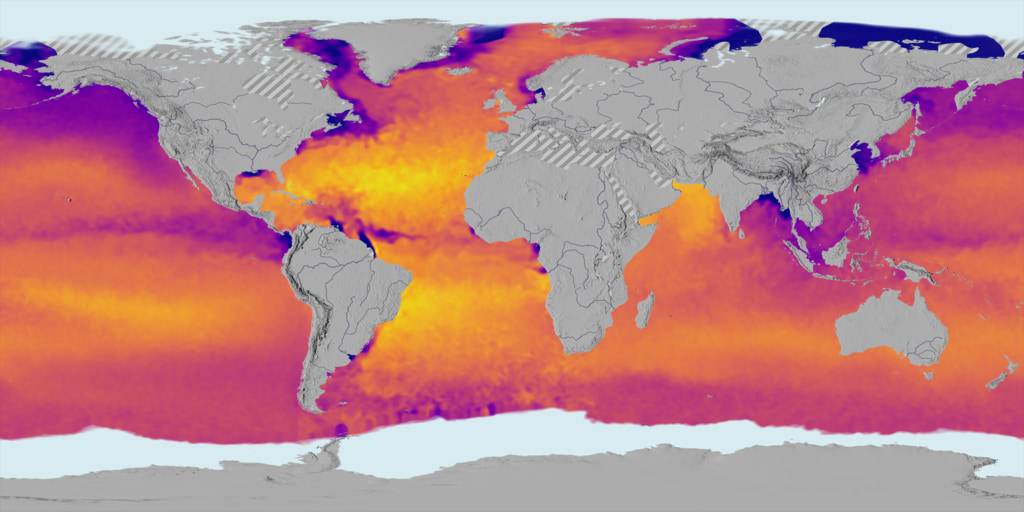
This animation shows the ocean SSS and sea ice thickness fields (shown over grid cells where the fractional ice coverage is greater than 15%) and the vertical integral of atmospheric precipitable water (transparent overlay) sampled every 6 hours from June 1, 2012 to November 1, 2014 from a reanalysis completed with the AXIOM-1 system. The precipitations associated with tropical cyclones and other major storm systems induce localized surface freshenings which makes the corresponding storm tracks visible in the SSS field.
- Atmosphere
- Atmospheric Water Vapor
- Atmospheric/ocean Indicators
- Climate Indicators
- Coupled Climate Models
- Cryosphere
- Earth Science
- Earth Science Reanalyses/Assimilation Models
- EARTH SCIENCE SERVICES
- HDTV
- Hyperwall
- Ice Depth/Thickness
- Models
- Oceans
- Precipitable Water
- Presentation
- Salinity
- Salinity/Density
- Sea Ice
- Sea Ice Concentration
- Sea Ice Thickness
- Snow/Ice
- Surface Salinity
Credits
Please give credit for this item to:
NASA's Scientific Visualization Studio
-
Animator
- Christian L. Keppenne (SSAI)
-
Project support
- Eric Sokolowsky (Global Science and Technology, Inc.)
- Steve Graham (Global Science and Technology, Inc.)
-
Scientist
- Christian L. Keppenne (SSAI)
Release date
This page was originally published on Friday, February 13, 2015.
This page was last updated on Sunday, April 7, 2024 at 12:27 AM EDT.
Datasets used in this visualization
-
AXIOM-1 (AXIOM-1 Coupled Reanalysis)
ID: 866
Note: While we identify the data sets used in these visualizations, we do not store any further details, nor the data sets themselves on our site.
Related
- ID: 5017
 Visualization
 - ID: 30584

- ID: 30524
 Hyperwall Visual