Updated ECCO (2014)
Global view of Sea Surface Temperature
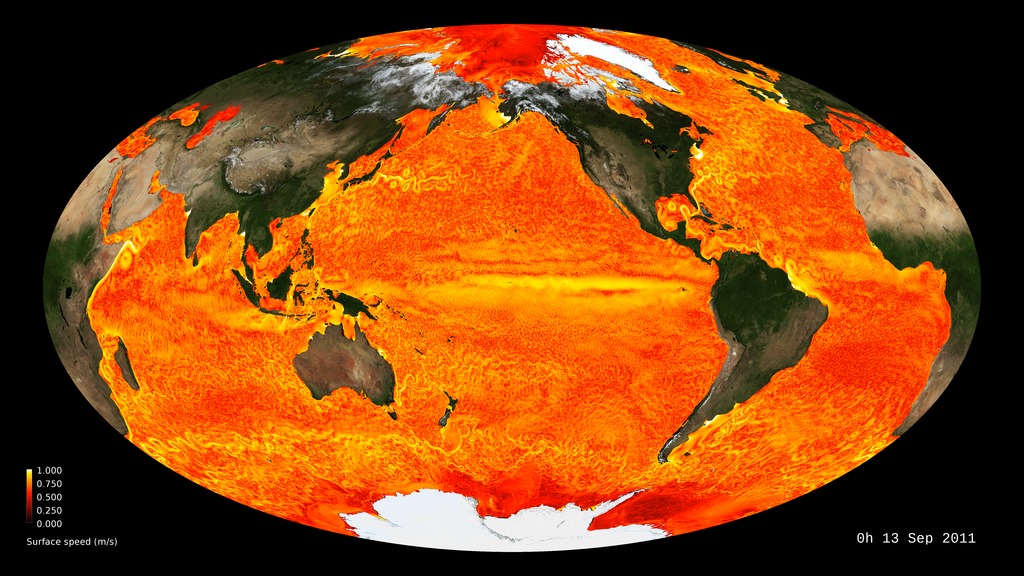
This visualization shows a view of looking down on a virtual (computer model) ocean from space as if you could:
see the upper one meter of ocean surface current speed;
speed up time by x86400, so that one second of elapsed time is equal to one day;
* see down to about one kilometer horizontal resolution.
The period of the visualization covers September 2011 through January 2012. The numerical formulation includes ocean circulation and tidal forcing and uses atmospheric state from reanalysis at a global resolution of about ¼ degree.
Source: ECCO model
View of Sea Surface Temperature centered on the Americas
View of Sea Surface Temperature centered on Indonesia.
For More Information
Credits
Please give credit for this item to:
NASA/JPL-Caltech
-
Project support
- Laurence Schuler (ADNET Systems, Inc.)
- Ian Jones (ADNET Systems, Inc.)
-
Animator
- Christopher E. Henze (NASA/ARC)
-
Scientist
- Dimitris Menemenlis (NASA/JPL CalTech)
Release date
This page was originally published on Wednesday, November 26, 2014.
This page was last updated on Tuesday, November 14, 2023 at 12:26 AM EST.
Datasets used in this visualization
-
ECCO3 High Resolution Ocean and Sea Ice Model
ID: 802
Note: While we identify the data sets used in these visualizations, we do not store any further details, nor the data sets themselves on our site.
Related
- ID: 30494
 Hyperwall Visual