A newer version of this visualization is available.
California Drought
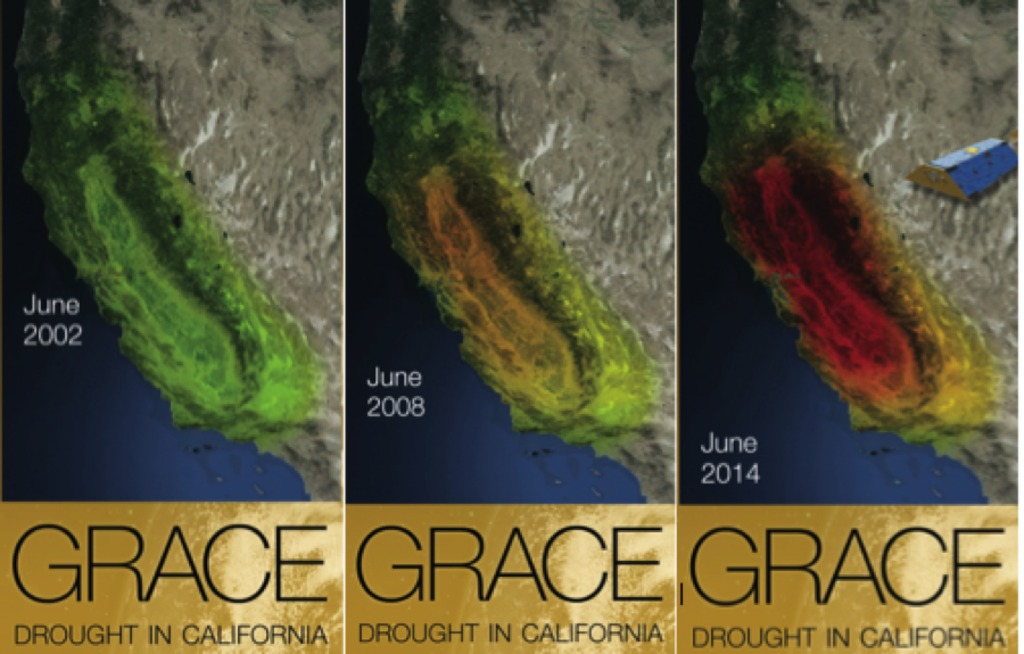
The NASA Gravity Recovery and Climate Experiment (GRACE) mission, launched in 2002, maps changes in Earth's gravity field resulting from the movement of water over the planet. As water moves around the globe — for example, due to flooding in some regions and drought in others — GRACE acts like a 'scale in the sky,' mapping the regions of Earth that are gaining or losing water each month. The GRACE mission has been particularly successful in monitoring the melting of the Greenland and Antartic ice sheets, and in mapping changing freshwater storage on land.
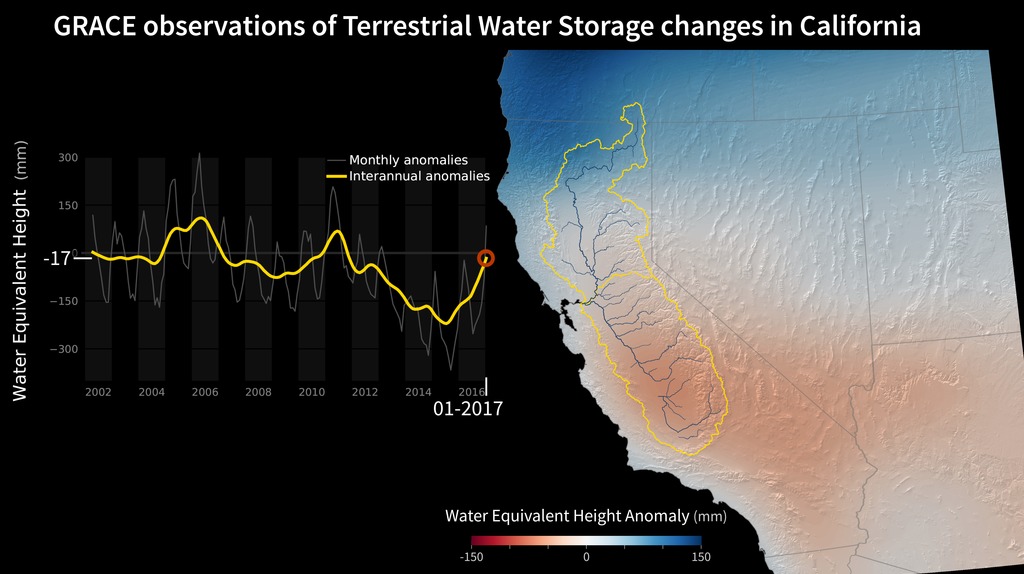
This animation shows how the total amount of water (all of the snow, surface water, soil moisture and groundwater) varies in space and time, with the passage of dry seasons and wet seasons as well as with flooding, drought and transport due to water management Blue colors represent wetter than average conditions (relative to the 2002-2013 time period) and the red colors represent drier than average conditions. The graph at the left shows the monthly changes for the average of map region outlined in yellow. The yellow line in the graph at the left shows interannual variations.
The Sacramento and San Joaquiin River basins are outlined in yellow and the rivers and their tributaries are shown by the blue lines. The basins include California's Central Valley, the most productive agricultural region in the United States. Ongoing drought in California has drained the state of nearly 15 cubic kilometers (12 miillion acre feet; 4 trillion gallons) of water in each of the last 3 years. Much of the loss is a result of groundwater depletion. Limited rainfall and snowmelt throughout the state has forced agriculture and cities to rely more heavily on groundwater reserves, resulting in rapid depletion of the aquifer beneath the Central Valley. At least 50% of the annual water loss is due to the removal of groundwater.
GRACE gravity data reveals water deficit in California.
Credits
Please give credit for this item to:
NASA
-
Animator
-
Producer
- Felix W. Landerer (NASA/JPL CalTech)
-
Scientist
- Jay Famiglietti (University of California, Irvine)
Release date
This page was originally published on Wednesday, October 1, 2014.
This page was last updated on Tuesday, November 14, 2023 at 12:26 AM EST.
Missions
This visualization is related to the following missions:Papers used in this visualization
Famiglietti, J. S., M. Lo, S. L. Ho, J. Bethune, K. J. Anderson, T. H. Syed, S. C. Swenson, C. R. de Linage, and M. Rodell (2011), Satellites measure recent rates of groundwater depletion in California's Central Valley, Geophys. Res. Lett., 38, L03403, doi:10.1029/2010GL046442.
Datasets used in this visualization
-
[Gravity Recovery and Climate Experiment (GRACE)]
ID: 221
Note: While we identify the data sets used in these visualizations, we do not store any further details, nor the data sets themselves on our site.
Related
- ID: 4363
 Visualization
Newer Versions
- ID: 30862
 Hyperwall Visual