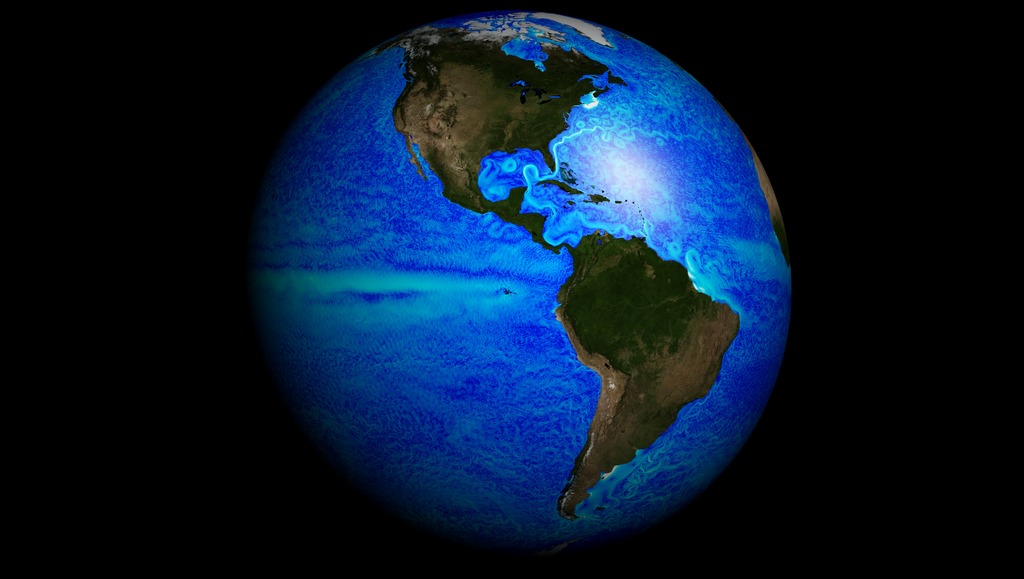
Simulated Sea Surface Speeds
This simulation shows sea surface speed in ultra-high resolution. Several oceanic characteristics are included in the simulation and are visible in its output; including tides, atmospheric pressure forcing, diurnal cycles, and dynamic/thermodynamic sea ice .
The model has a .75 to 2.2 km horizontal grid spacing and 90 vertical levels, with 1-m vertical levels near the surface. The full 3D grid is output at hourly intervals.
Yellow shades represent relatively fast sea surface speeds, while red shades represent slower speeds. The simulation was carried out using the Massachusetts Institute of Technology general circulation model (mitgcm.org) by the Estimating the Circulation and Climate of the Ocean (ECCO) group.
Credits:
C. Hill, G. Forget (MIT)
C. Henze, B. Nelson, B. Ciotti (Ames)
D. Menemenlis (JPL)
A. Chaudhuri (AER)
MITgcm/ECCO developers and users
SGI and NAS computer scientists and engineers
Sea Surface Speeds are simulated in very high resolution.
A close-up view of the Drake passage shows the high resolution of the model.
For More Information
See ecco-group.org
Credits
Please give credit for this item to:
JPL
-
Project support
- Leann Johnson (Global Science and Technology, Inc.)
- Laurence Schuler (ADNET Systems, Inc.)
- Ian Jones (ADNET Systems, Inc.)
Release date
This page was originally published on Saturday, March 1, 2014.
This page was last updated on Tuesday, November 14, 2023 at 12:25 AM EST.
Related
- ID: 30552
 Hyperwall Visual