Aug. 25th, 2022
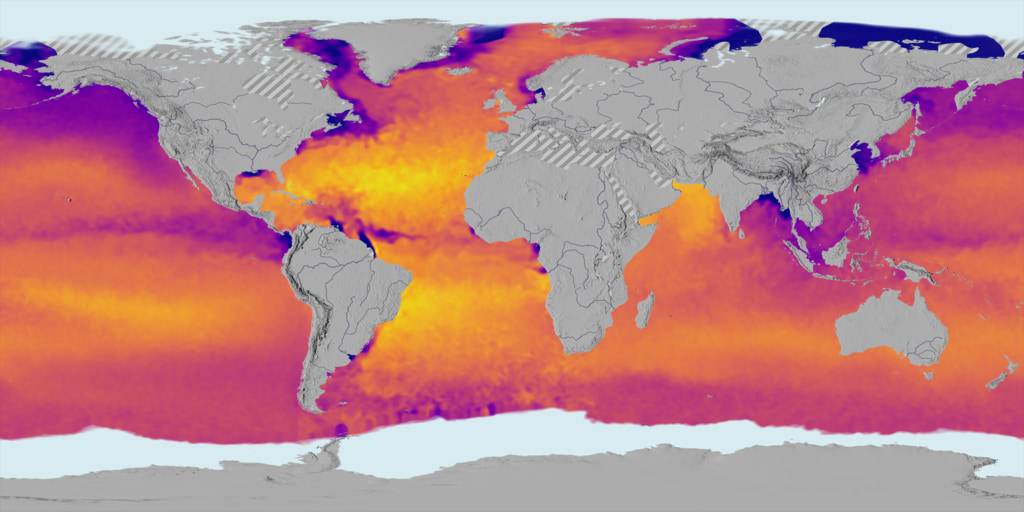
This data visualization shows sea surface salinity (i.e., ocean salt concentration) over a ten year period (2011 to 2021). Warm colors (orange to yellow) are areas of high salinity/hot tropics. Cooler colors (blue to violet) are fresher waters, many of which can be seen coming from rainy/river/wetter tropics. Sea Surface Salinity (i.e., ocean salt) colorbar. Date overlay for above data visualization. Example composite animation using the colorbar and date overlays. The heat of the sun forces evaporation at the ocean's surface, which puts water vapor into the atmosphere but leaves minerals and salts behind, keeping the ocean salty. The salinity of the ocean also varies from place to place, because evaporation varies based on the sea surface temperature and wind, rivers and rain storms inject fresh water into the ocean, and melting or freezing sea ice affects the salinity of polar waters. Related pages
Read more