A newer version of this visualization is available.
Arctic Yearly Minimum Sea Ice Extent 1979-2003
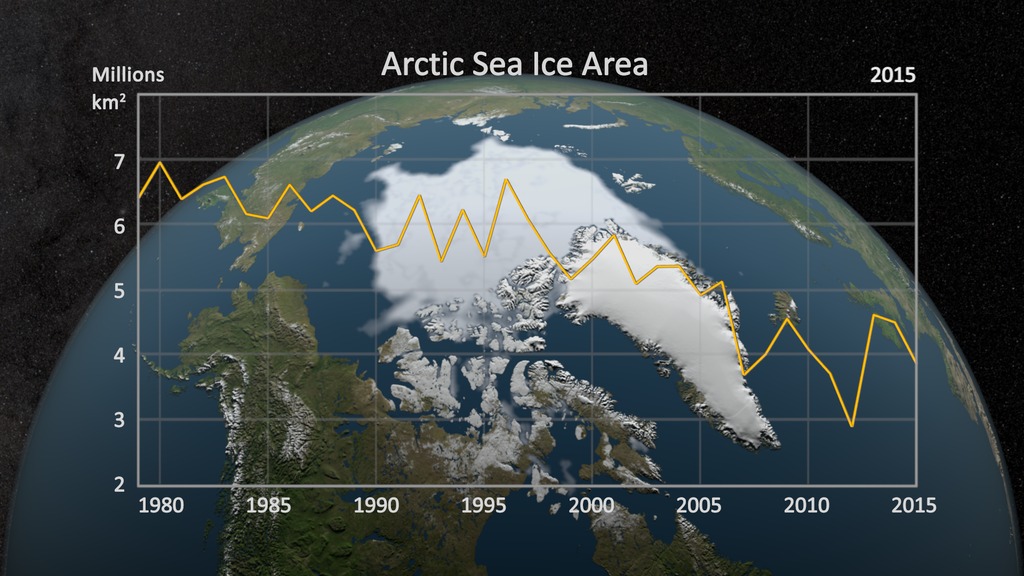
This animation shows the Arctic yearly minimum sea ice extent from September for each year from 1979 through 2003. The average sea ice extent from 1979-2002 is outlined in orange.
This animation shows the yearly minimum sea ice extent from September for each year from 1979 through 2003.

An image of the minimum sea ice extent in 1979 (September)
An image of the minimum sea ice extent in 1980 (September)
An image of the minimum sea ice extent in 1981 (September)
An image of the minimum sea ice extent in 1982 (September)
An image of the minimum sea ice extent in 1983 (September)
An image of the minimum sea ice extent in 1984 (September)
An image of the minimum sea ice extent in 1985 (September)
An image of the minimum sea ice extent in 1986 (September)
An image of the minimum sea ice extent in 1987 (September)
An image of the minimum sea ice extent in 1988 (September)
An image of the minimum sea ice extent in 1989 (September)
An image of the minimum sea ice extent in 1990 (September)
An image of the minimum sea ice extent in 1991 (September)
An image of the minimum sea ice extent in 1992 (September)
An image of the minimum sea ice extent in 1993 (September)
An image of the minimum sea ice extent in 1994 (September)
An image of the minimum sea ice extent in 1995 (September)
An image of the minimum sea ice extent in 1996 (September)
An image of the minimum sea ice extent in 1997 (September)
An image of the minimum sea ice extent in 1998 (September)
An image of the minimum sea ice extent in 1999 (September)
An image of the minimum sea ice extent in 2000 (September)
An image of the minimum sea ice extent in 2001 (September)
An image of the minimum sea ice extent in 2002 (September)
An image of the minimum sea ice extent in 2003 (September)
Credits
Please give credit for this item to:
NASA/Goddard Space Flight Center
Scientific Visualization Studio
-
Visualizer
- Cindy Starr (Global Science and Technology, Inc.)
-
Scientist
- Walt Meier (NSIDC)
Release date
This page was originally published on Tuesday, June 13, 2006.
This page was last updated on Wednesday, May 3, 2023 at 1:55 PM EDT.
Series
This visualization can be found in the following series:Datasets used in this visualization
-
Passive Microwave Data (15% Mean Sea Ice Extent Contour for September) [DMSP: SSM/I]
ID: 287 -
Passive Microwave Data (15% Mean Sea Ice Extent Contour for September) [Nimbus-7: SSMR]
ID: 419 -
September Mean Sea Ice Extent [DMSP: SSM/I]
ID: 571
Note: While we identify the data sets used in these visualizations, we do not store any further details, nor the data sets themselves on our site.
Newer Versions
- ID: 4435
 Visualization