NASA's NICER Tracks a Magnetar's Hot Spots
Explore how NASA’s Neutron star Interior Composition Explorer (NICER) tracked brilliant hot spots on the surface of an erupting magnetar – from 13,000 light-years away.
Credit: NASA's Goddard Space Flight Center
Music: "Particles and Fields" from Universal Production Music
Watch this video on the NASA Goddard YouTube channel.
Complete transcript available.
For the first time, NASA’s Neutron star Interior Composition Explorer (NICER) has observed the merging of multimillion-degree X-ray spots on the surface of a magnetar, a supermagnetized stellar core no larger than a city.
NICER tracked how three bright, X-ray-emitting hot spots slowly wandered across the object’s surface while also decreasing in size, providing the best look yet at this phenomenon. The largest spot eventually coalesced with a smaller one, which is something astronomers haven’t seen before
A magnetar is a type of isolated neutron star, the crushed core left behind when a massive star explodes. Compressing more mass than the Sun’s into a ball about 12 miles (20 kilometers) across, a neutron star is made of matter so dense that a teaspoonful would weigh as much as a mountain on Earth.
What sets magnetars apart is that they sport the strongest magnetic fields known, up to 10 trillion times more intense than a refrigerator magnet’s and a thousand times stronger than a typical neutron star’s. The magnetic field represents an enormous storehouse of energy that, when disturbed, can power an outburst of enhanced X-ray activity lasting from months to years.
On Oct. 10, 2020, NASA’s Neil Gehrels Swift Observatory discovered just such an outburst from a new magnetar, called SGR 1830-0645 (SGR 1830 for short). It’s located in the constellation Scutum, and while its distance is not precisely known, astronomers estimate that the object lies about 13,000 light-years away. Swift turned its X-Ray Telescope to the source, detecting repeated pulses that revealed the object was rotating every 10.4 seconds.
NICER measurements from the same day show that the X-ray emission exhibited three close peaks with every rotation. They were caused when three individual surface regions much hotter than their surroundings spun into and out of our view.
NICER observed SGR 1830 almost daily from its discovery to Nov. 17, after which the Sun was too close to the field of view for safe observation. Over this period, the emission peaks gradually shifted, occurring at slightly different times in the magnetar’s rotation. The results favor a model where the spots form and move as a result of crustal motion, in much the same way as the motion of tectonic plates on Earth drives seismic activity.
The team thinks these observations reveal a single active region where the crust has become partially molten, slowly deforming under magnetic stress. The three moving hot spots likely represent locations where coronal loops – similar to the bright, glowing arcs of plasma seen on the Sun – connect to the surface. The interplay between the loops and crustal motion drives the drifting and merging behavior.
En español. Averigua cómo el telescopio Explorador de la Composición Interior de las Estrellas de Neutrones (NICER por sus siglas en inglés) de la NASA rastreó unos puntos calientes brillantes en la superficie de un magnetar en erupción – desde 13.000 años luz de distancia. Crédito: NASA: Centro de Vuelo Espacial Goddard
Credit: NASA's Goddard Space Flight Center
Music: "Particles and Fields" from Universal Production Music
Watch this video on the NASA Goddard YouTube channel.
Complete transcript available.
This plot tracks 37 days of change in SGR 1830’s peak X-ray emission as seen by NASA’s Neutron star Interior Composition Explorer (NICER). In this graph, the star’s rotational phase advances from left to right, with the measured energy shown vertically. The green, yellow, and red areas indicate regions producing the greatest numbers of X-rays and are thought to represent the magnetar’s hot spots. They change in intensity and in their positions relative to one another as time goes on. For the first time, astronomers recorded two such spots merging.
Credit: NASA/NICER/G. Younes et al. 2022
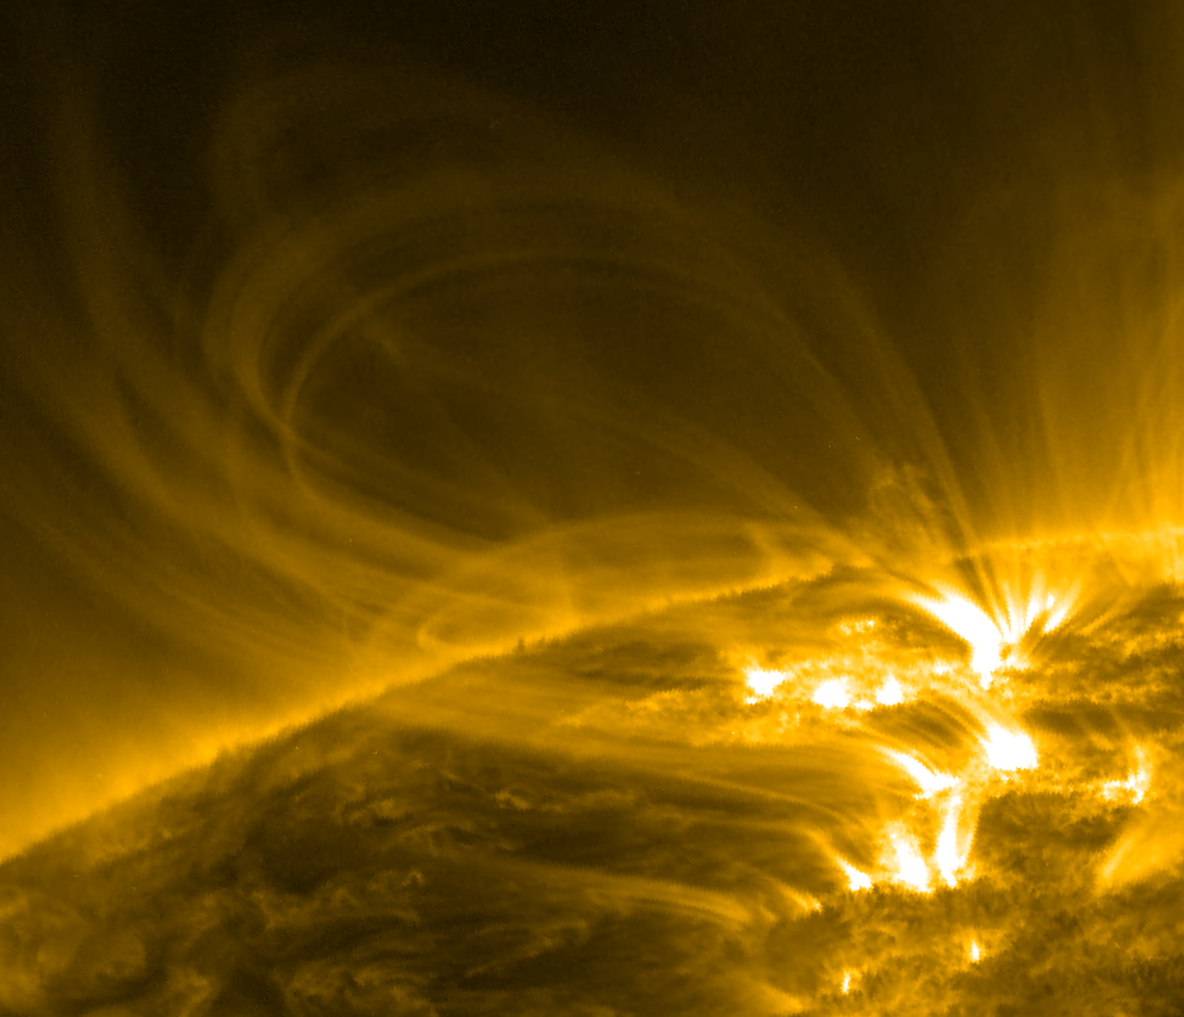
Cropped version of image below. Scientists think SGR 1830’s hot spots likely resembled the bases of coronal loops frequently seen on the Sun. In this extreme ultraviolet view from NASA’s Solar Dynamics Observatory, loops of ionized gas trace magnetic fields emerging from the solar surface.
Credit: NASA/SDO
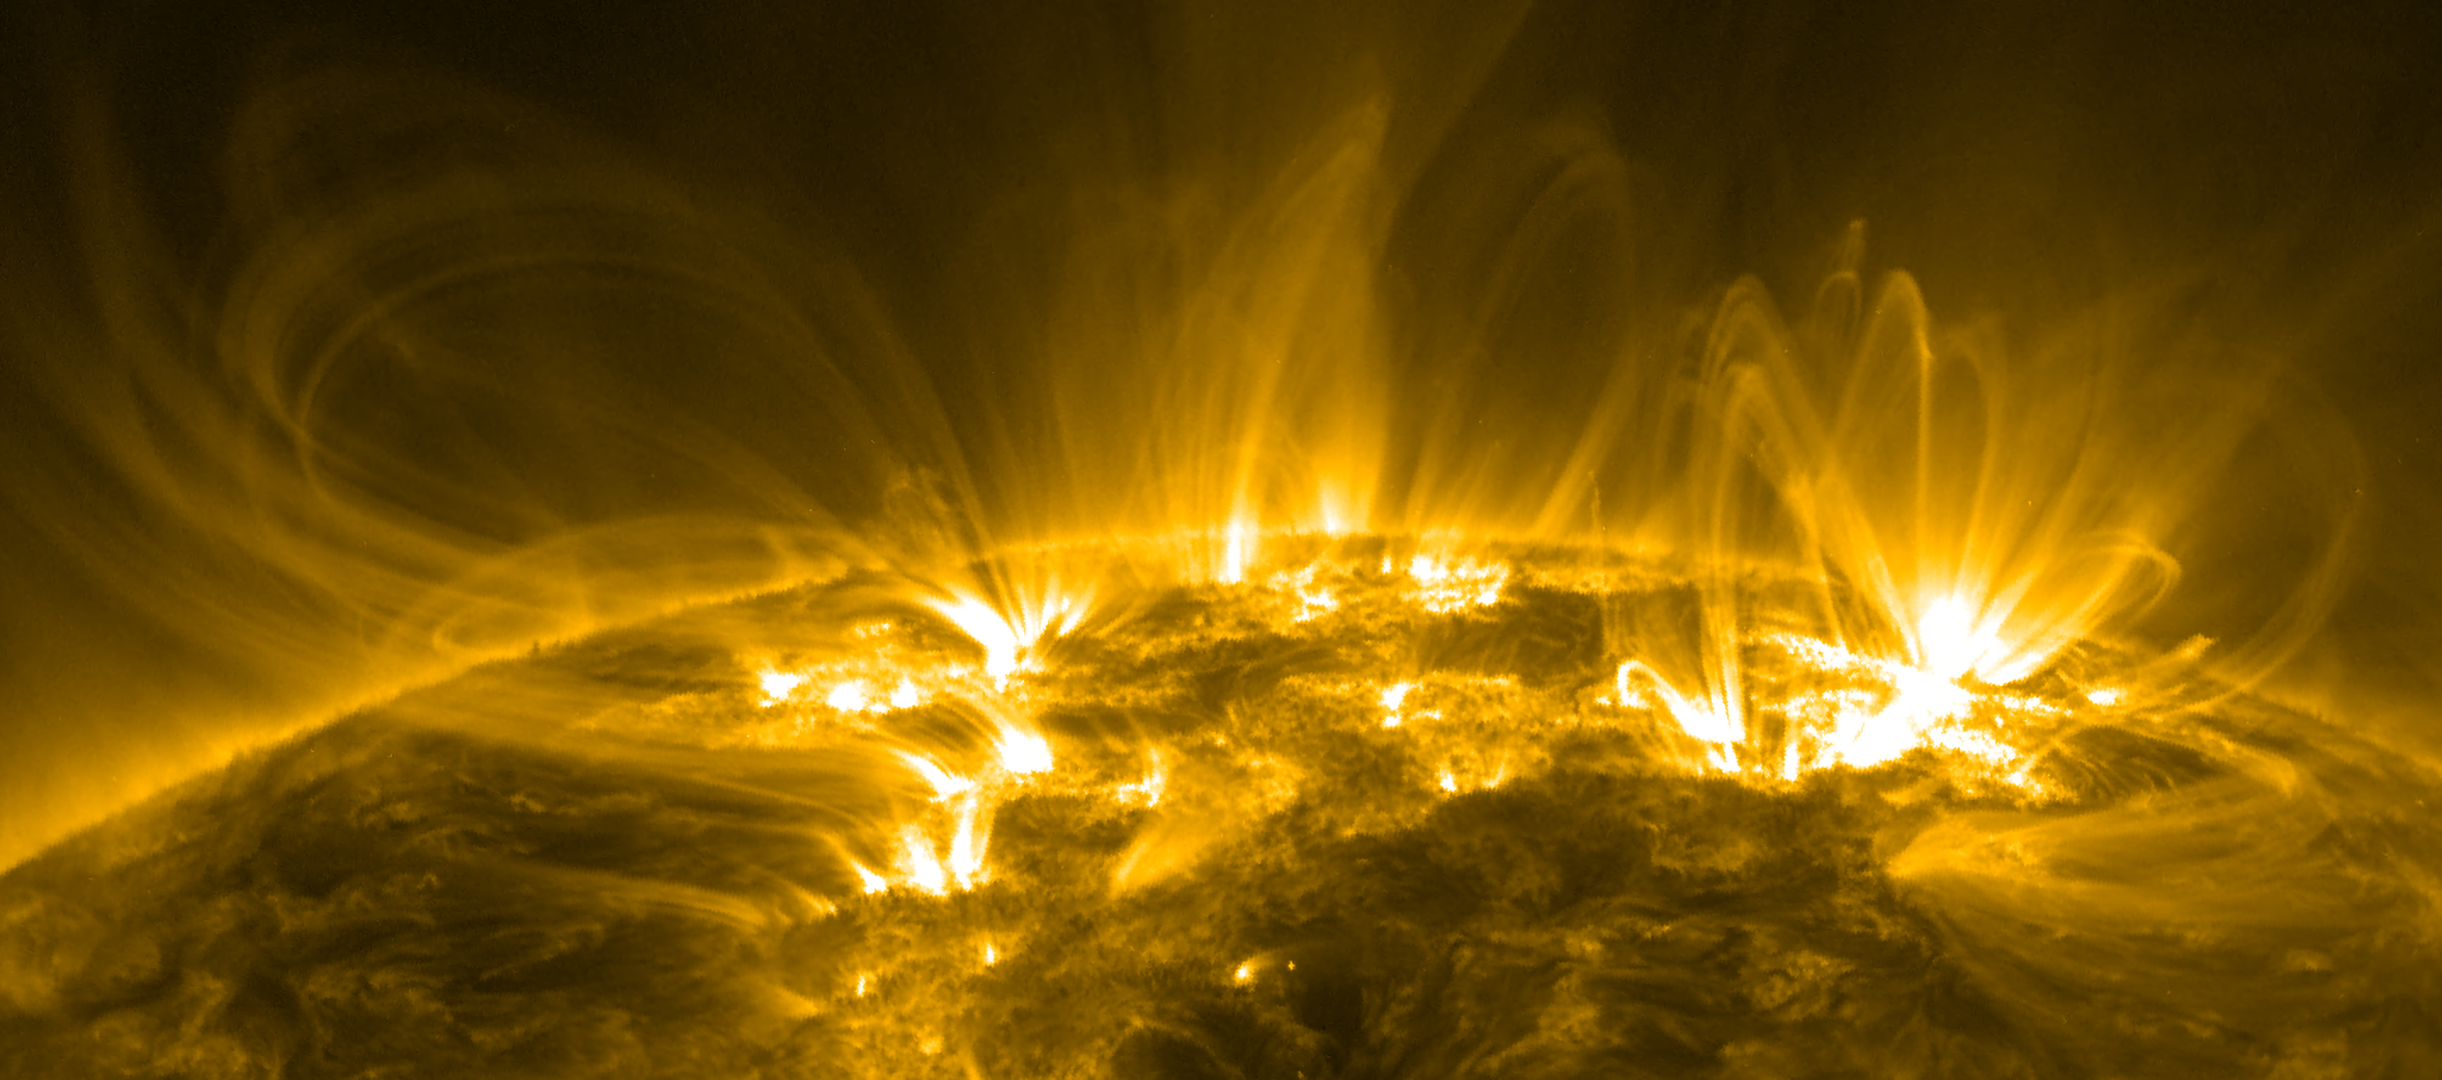
Wider version of the image above. Scientists think SGR 1830’s hot spots likely resembled the bases of coronal loops frequently seen on the Sun. In this extreme ultraviolet view from NASA’s Solar Dynamics Observatory, loops of ionized gas trace magnetic fields emerging from the solar surface.
Credit: NASA/SDO
Version with no on-screen text
Explore how NASA’s Neutron star Interior Composition Explorer (NICER) tracked brilliant hot spots on the surface of an erupting magnetar – from 13,000 light-years away.
Credit: NASA's Goddard Space Flight Center
Music: "Particles and Fields" from Universal Production Music
For More Information
Credits
Please give credit for this item to:
NASA's Goddard Space Flight Center. However, individual items should be credited as indicated above.
-
Producer
- Scott Wiessinger (KBR Wyle Services, LLC)
-
Science writer
- Francis Reddy (University of Maryland College Park)
-
Animator
- Krystofer Kim (KBR Wyle Services, LLC)
-
Scientist
- George Younes (George Washington University/GSFC)
Release date
This page was originally published on Tuesday, March 8, 2022.
This page was last updated on Wednesday, May 3, 2023 at 11:44 AM EDT.
Missions
This visualization is related to the following missions:Series
This visualization can be found in the following series:Papers used in this visualization
Sources
- ID: 20359
 Animation