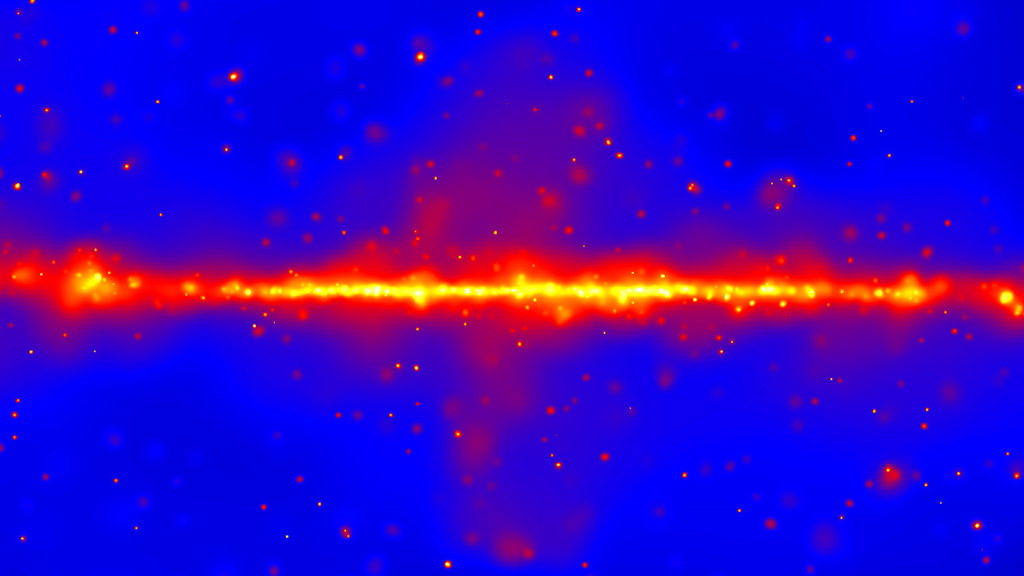
Fermi's 12-year View of the Gamma-ray Sky

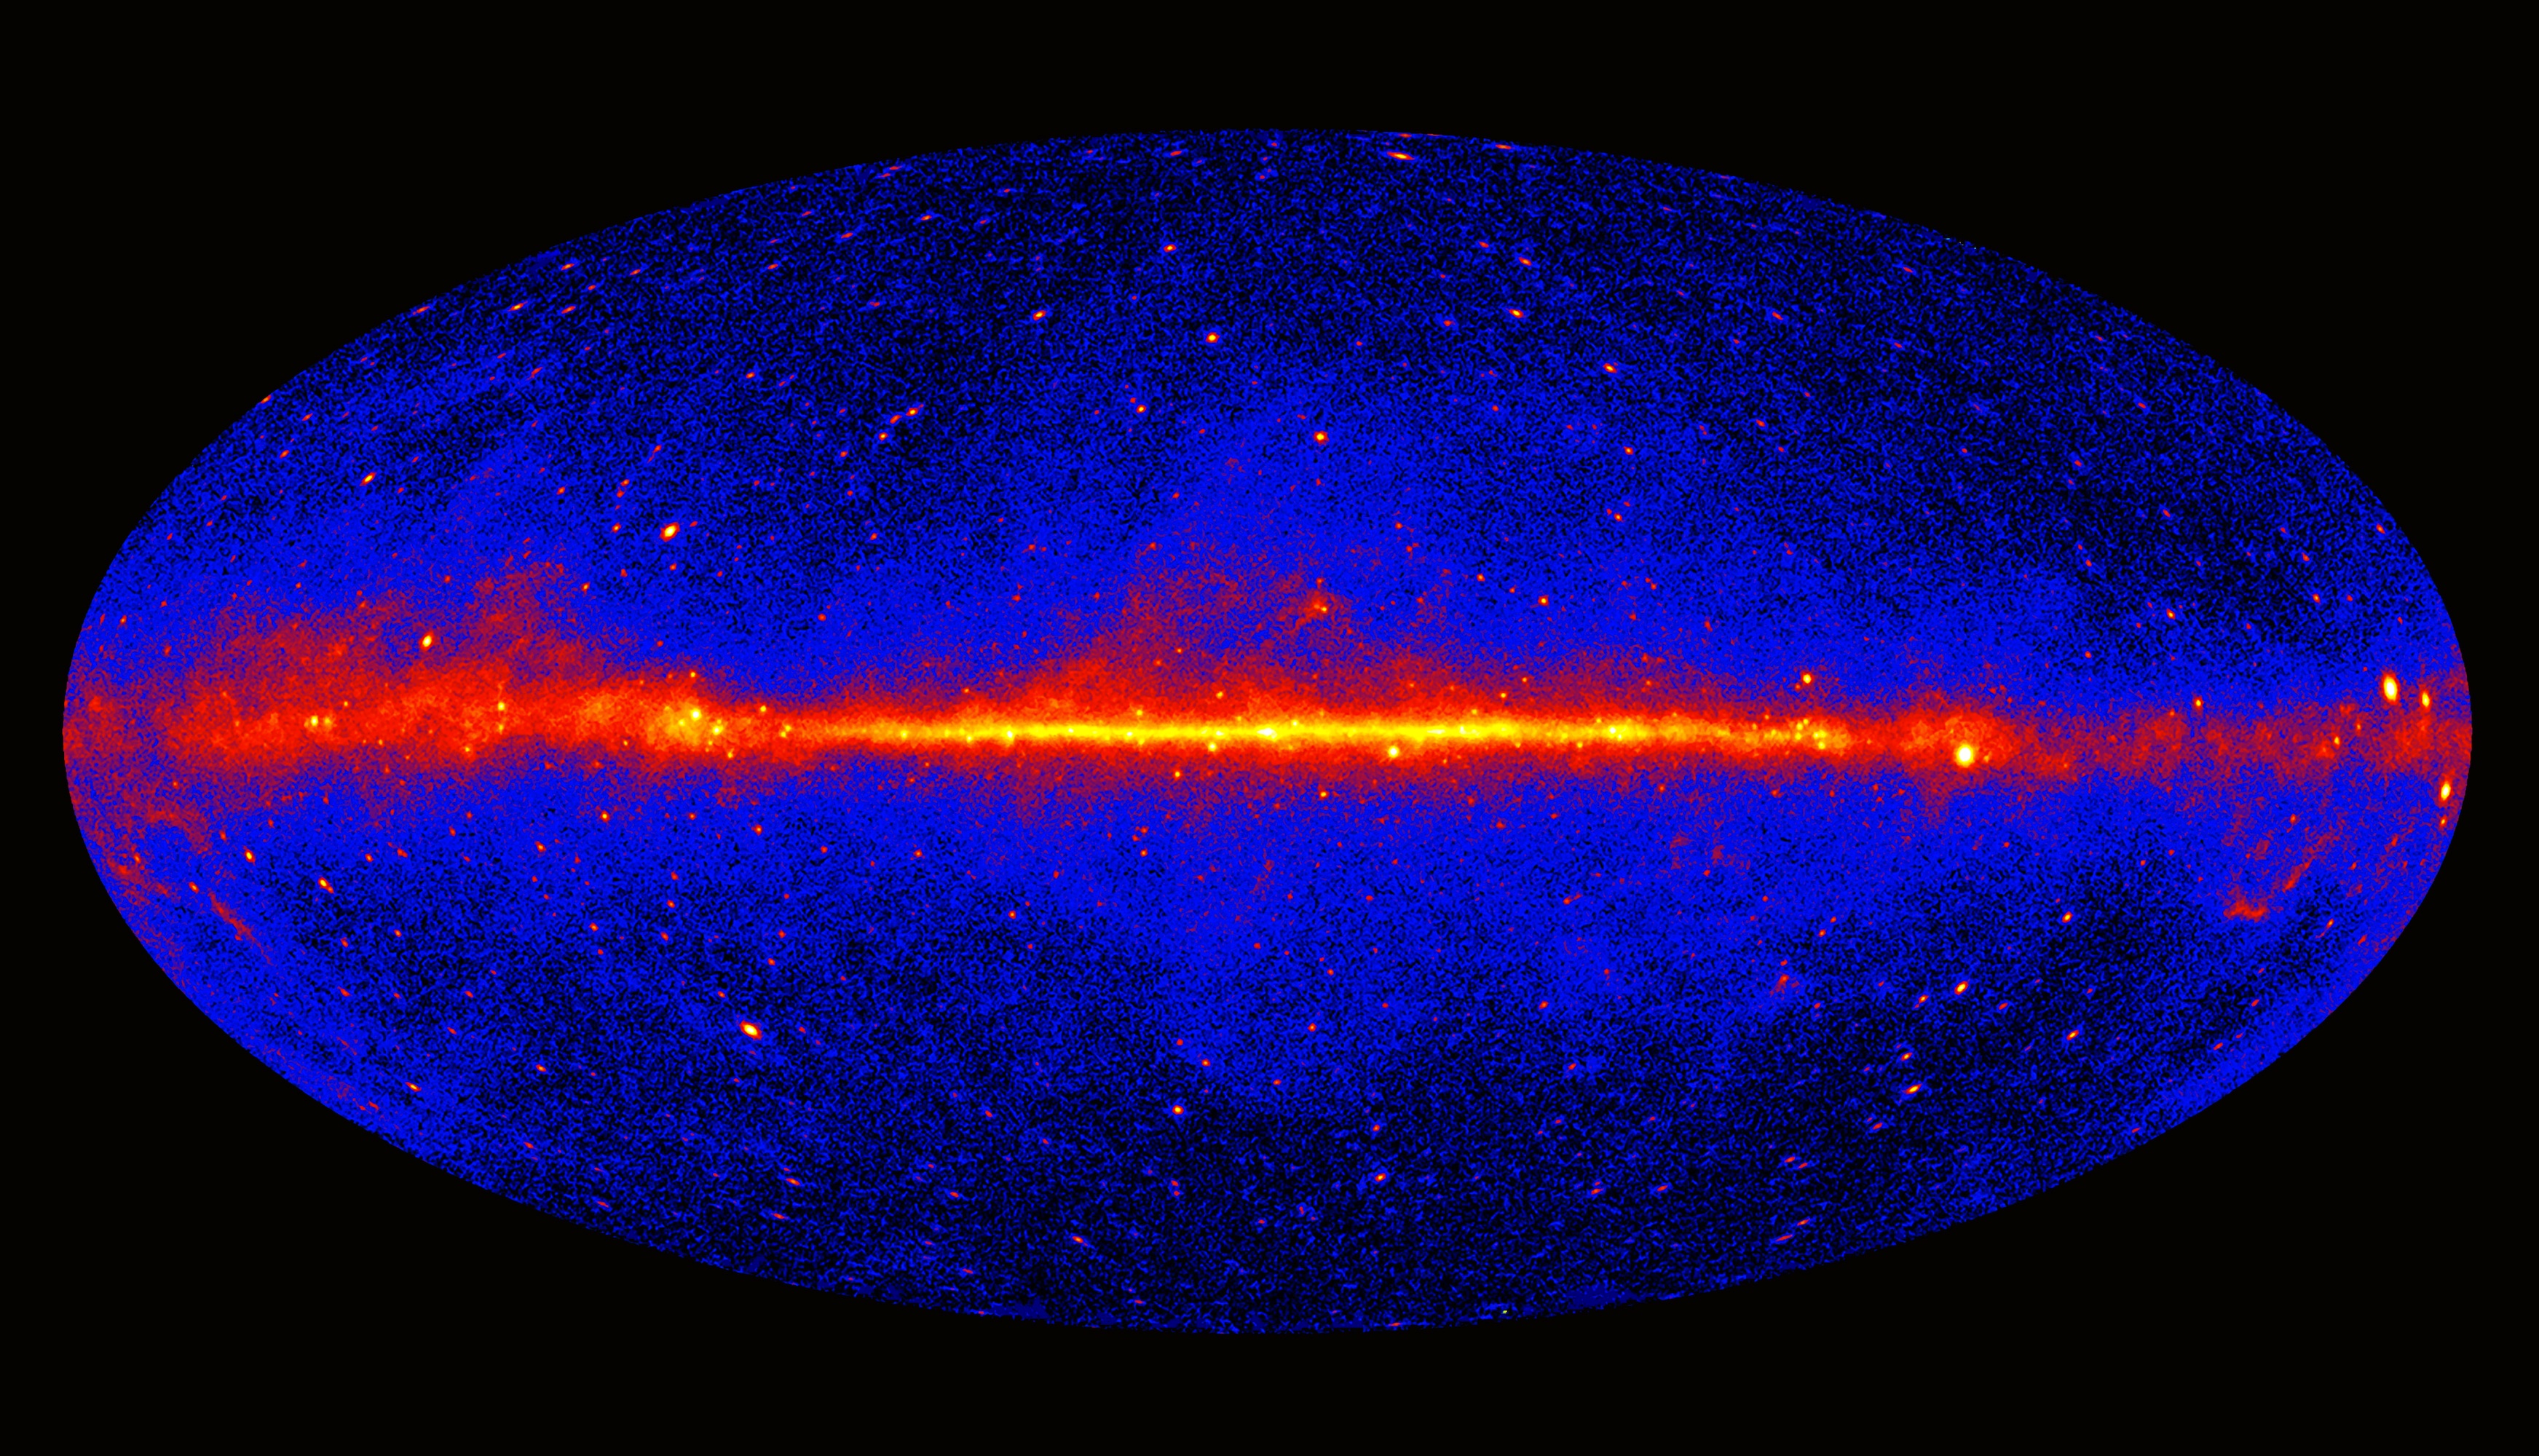
This image shows the entire sky as seen by Fermi's Large Area Telescope. The most prominent feature is the bright, diffuse glow running along the middle of the map, which marks the central plane of our Milky Way galaxy. The gamma rays there are mostly produced when energetic particles accelerated in the shock waves of supernova remnants collide with gas atoms and even light between the stars. Many of the star-like features above and below the Milky Way plane are distant galaxies powered by supermassive black holes. Many of the bright sources along the plane are pulsars. The image was constructed from 12 years of observations using front-converting gamma rays with energies greater than 1 GeV. Hammer projection.
Credit: NASA/DOE/Fermi LAT Collaboration
These all-sky view shows how the sky appears at energies greater than 1 billion electron volts (GeV) according to 12 years of data from NASA's Fermi Gamma-ray Space Telescope. (For comparison, the energy of visible light is between 2 and 3 electron volts.) The image contains 144 months of data from Fermi's Large Area Telescope; for better angular resolution, the map shows only gamma rays detected at the front of the instrument's tracker. Lighter colors indicate brighter gamma-ray sources. The images show the entire sky in galactic coordinates, in which the center is the center of our galaxy. The bright midplane of our galaxy runs across the images.
Same as above but in the equidistant cylindrical projection.
Credit: NASA/DOE/Fermi LAT Collaboration
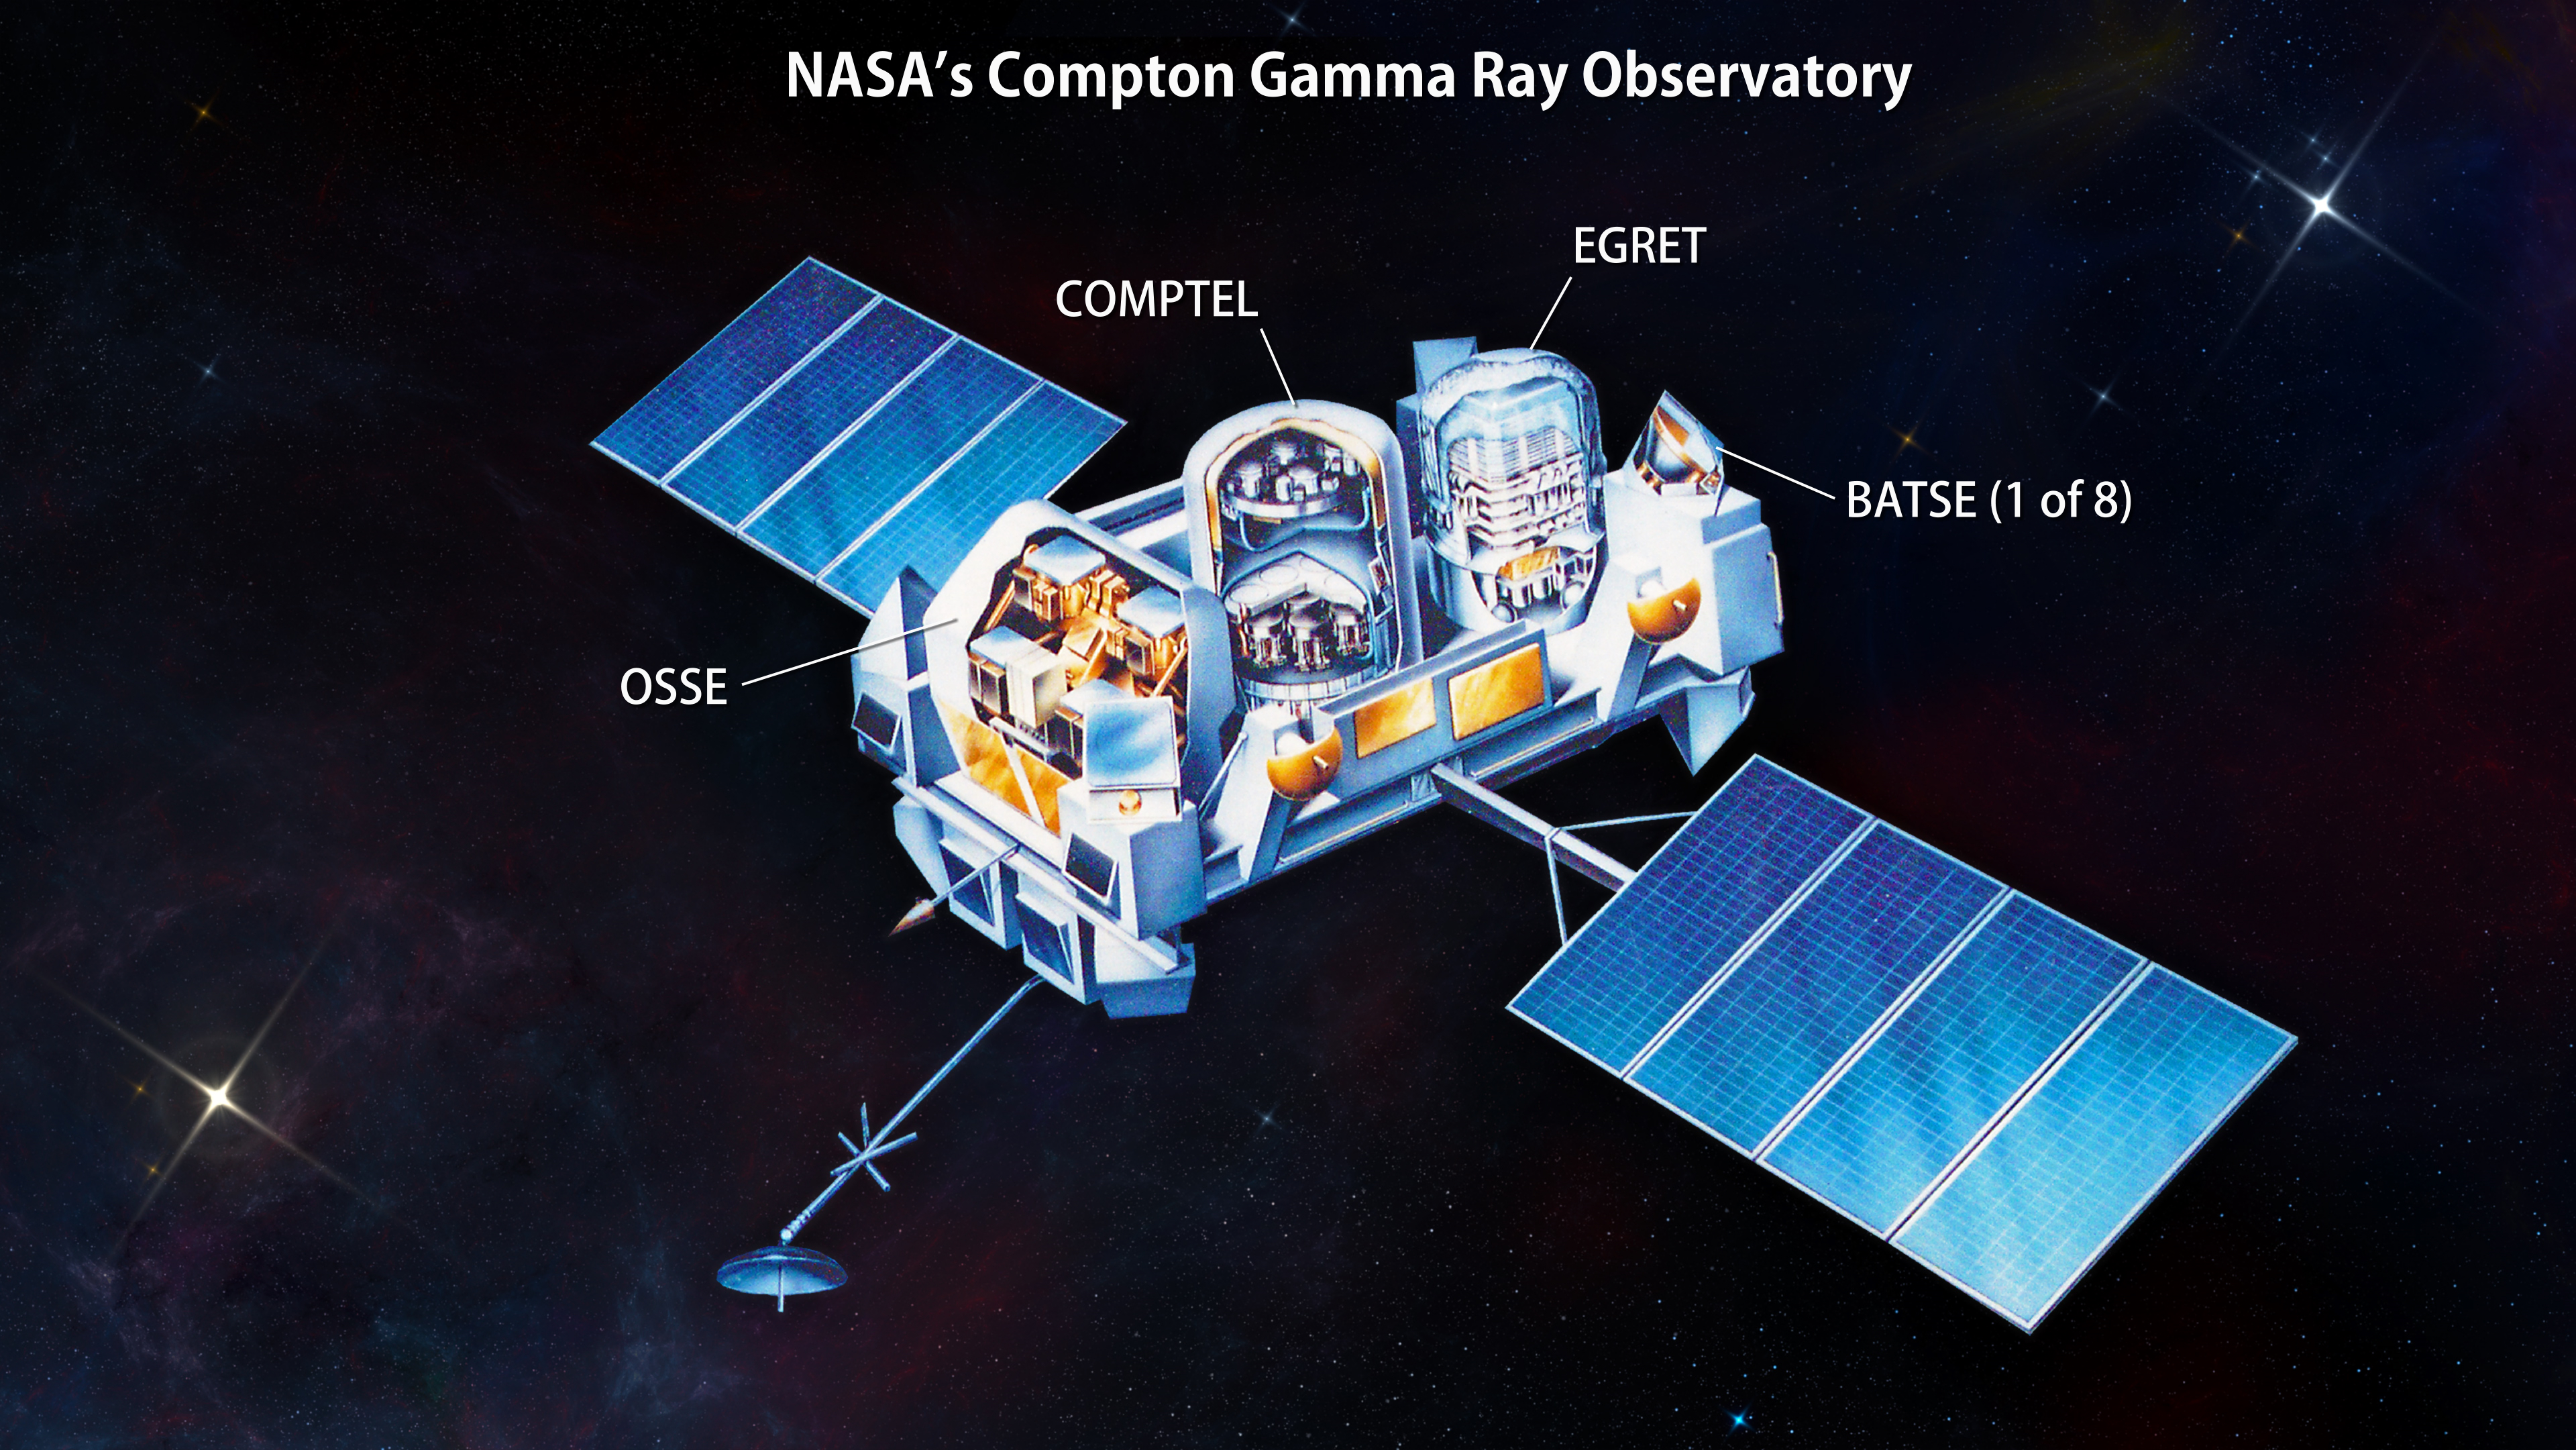
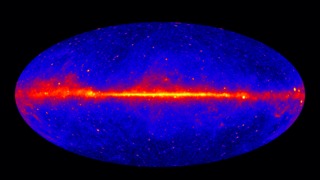
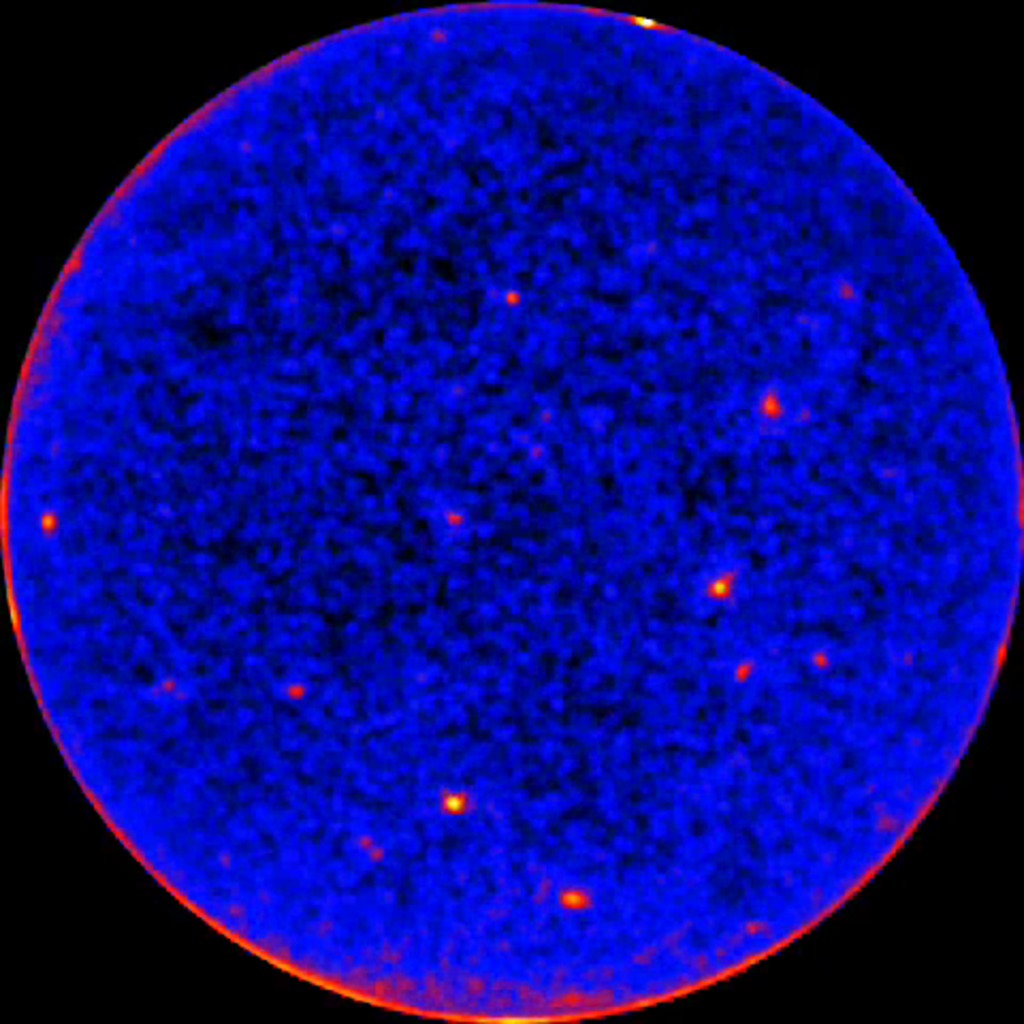
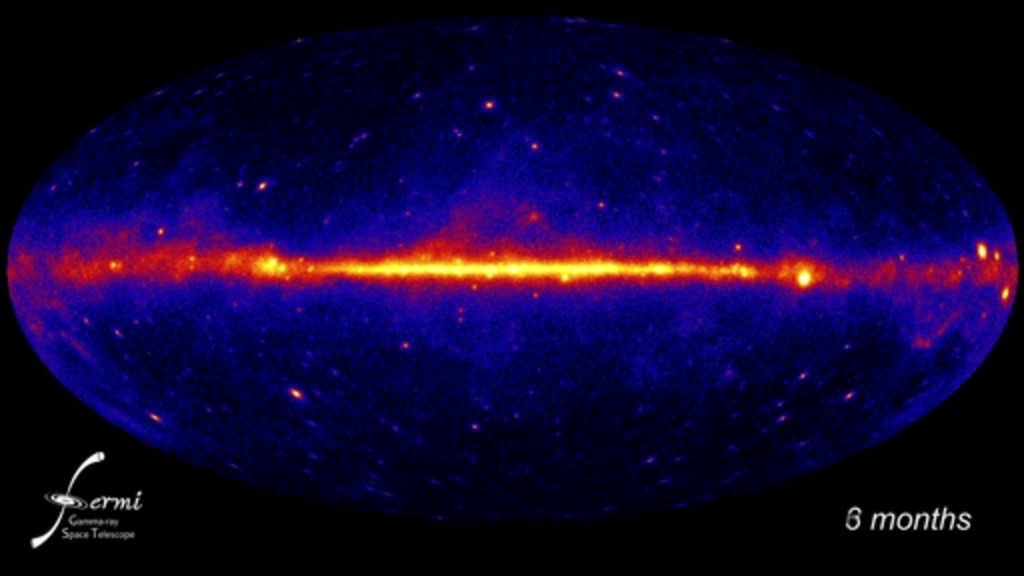
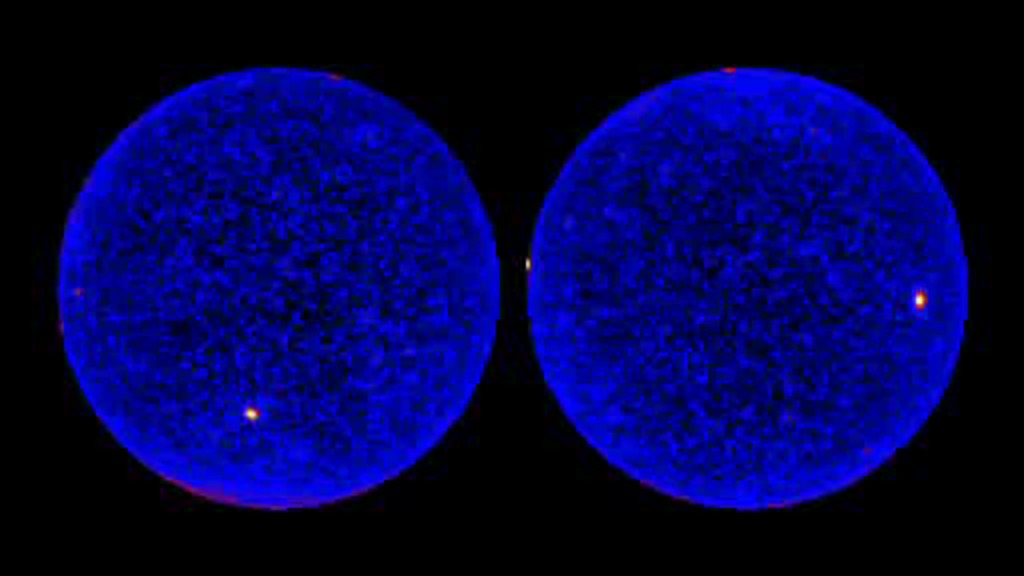
This animation cycles between images that encapsulate decades of progress in gamma-ray astrophysics. The lower-resolution image shows the sky as seen by the EGRET instrument aboard NASA's Compton Gamma-Ray Observatory (1991 to 2000) using gamma rays above 100 million electron volts. Lighter colors indicate greater numbers of gamma rays. The most prominent feature is the central plane of our galaxy, which runs across the middle of the map, a result of gamma rays produced when accelerated particles strike interstellar gas and starlight. The largest yellow spot on the right side of the galactic plane is the Vela pulsar, one of five new gamma-ray pulsars EGRET discovered. The prominent reddish blob at top right is the blazar 3C 279. The all-sky map produced by Fermi's Large Area Telescope (LAT), using 12 years of data, is sharper, more detailed, and shows gamma rays of much higher ennergy than EGRET's. In its first five years, the LAT detected more than 10 times the number of gamma-ray sources seen by EGRET and had captured more high-energy gamma rays from a single source, the Vela pulsar, than the total number EGRET detected from all sources.
Credit: NASA/EGRET Team and NASA/DOE/Fermi LAT Collaboration
These images encapsulate decades of progress in gamma-ray astrophysics. Top: The sky as seen by the EGRET instrument aboard NASA's Compton Gamma-Ray Observatory (1991 to 2000) using gamma rays above 100 million electron volts. Lighter colors indicate greater numbers of gamma rays. The most prominent feature is the central plane of our galaxy, which runs across the middle of the map, a result of gamma rays produced when accelerated particles strike interstellar gas and starlight. The largest yellow spot on the right side of the galactic plane is the Vela pulsar, one of five new gamma-ray pulsars EGRET discovered. The prominent reddish blob at top right is the blazar 3C 279. Bottom: The all-sky map produced by Fermi's Large Area Telescope (LAT), using 12 years of data, is sharper, more detailed, and shows gamma rays of much higher ennergy than EGRET's. In its first five years, the LAT detected more than 10 times the number of gamma-ray sources seen by EGRET and had captured more high-energy gamma rays from a single source, the Vela pulsar, than the total number EGRET detected from all sources.
Credit: NASA/EGRET Team and NASA/DOE/Fermi LAT Collaboration
Credits
Please give credit for this item to:
NASA's Goddard Space Flight Center
-
Science writer
- Francis Reddy (University of Maryland College Park)
Release date
This page was originally published on Saturday, February 12, 2022.
This page was last updated on Wednesday, May 3, 2023 at 1:37 PM EDT.
Missions
This visualization is related to the following missions:Datasets used in this visualization
-
[Fermi: LAT]
ID: 216Fermi Gamma-ray Large Area Space Telescope (GLAST) Large Area Telescope (LAT)
This dataset can be found at: http://fermi.gsfc.nasa.gov
See all pages that use this dataset
Note: While we identify the data sets used in these visualizations, we do not store any further details, nor the data sets themselves on our site.
Related
- ID: 12194
 Produced Video
 - ID: 12121
 Produced Video
 - ID: 12022
 Produced Video
 - ID: 11342
 Produced Video
 - ID: 10887
 Produced Video
 - ID: 10819
 Produced Video
 - ID: 10505
- ID: 10508
 Produced Video
 - ID: 10407
 Produced Video