11 Years Charting The Edge of The Solar System
Watch this video on the NASA Goddard YouTube channel.
Music credits: “End of Days - Joe Mason Remix” by Connor Shambrook [BMI], Cyrus Reynolds [BMI], Flynn Hase Spence [ASCAP], Joseph Scott Mason [APRA]; “Brainstorming” by Laurent Dury [SACEM]; “Flight of the Leaf Remix” by Julie Gruss [GEMA], Laurent Dury [SAXEM]; “Ticks and Thoughts” by Laurent Dury [SACEM]; “Intimate Journey” by Laurent Vernerey [SACEM], Nicolas de Ferran [SACEM] from Universal Production Music
Complete transcript available.
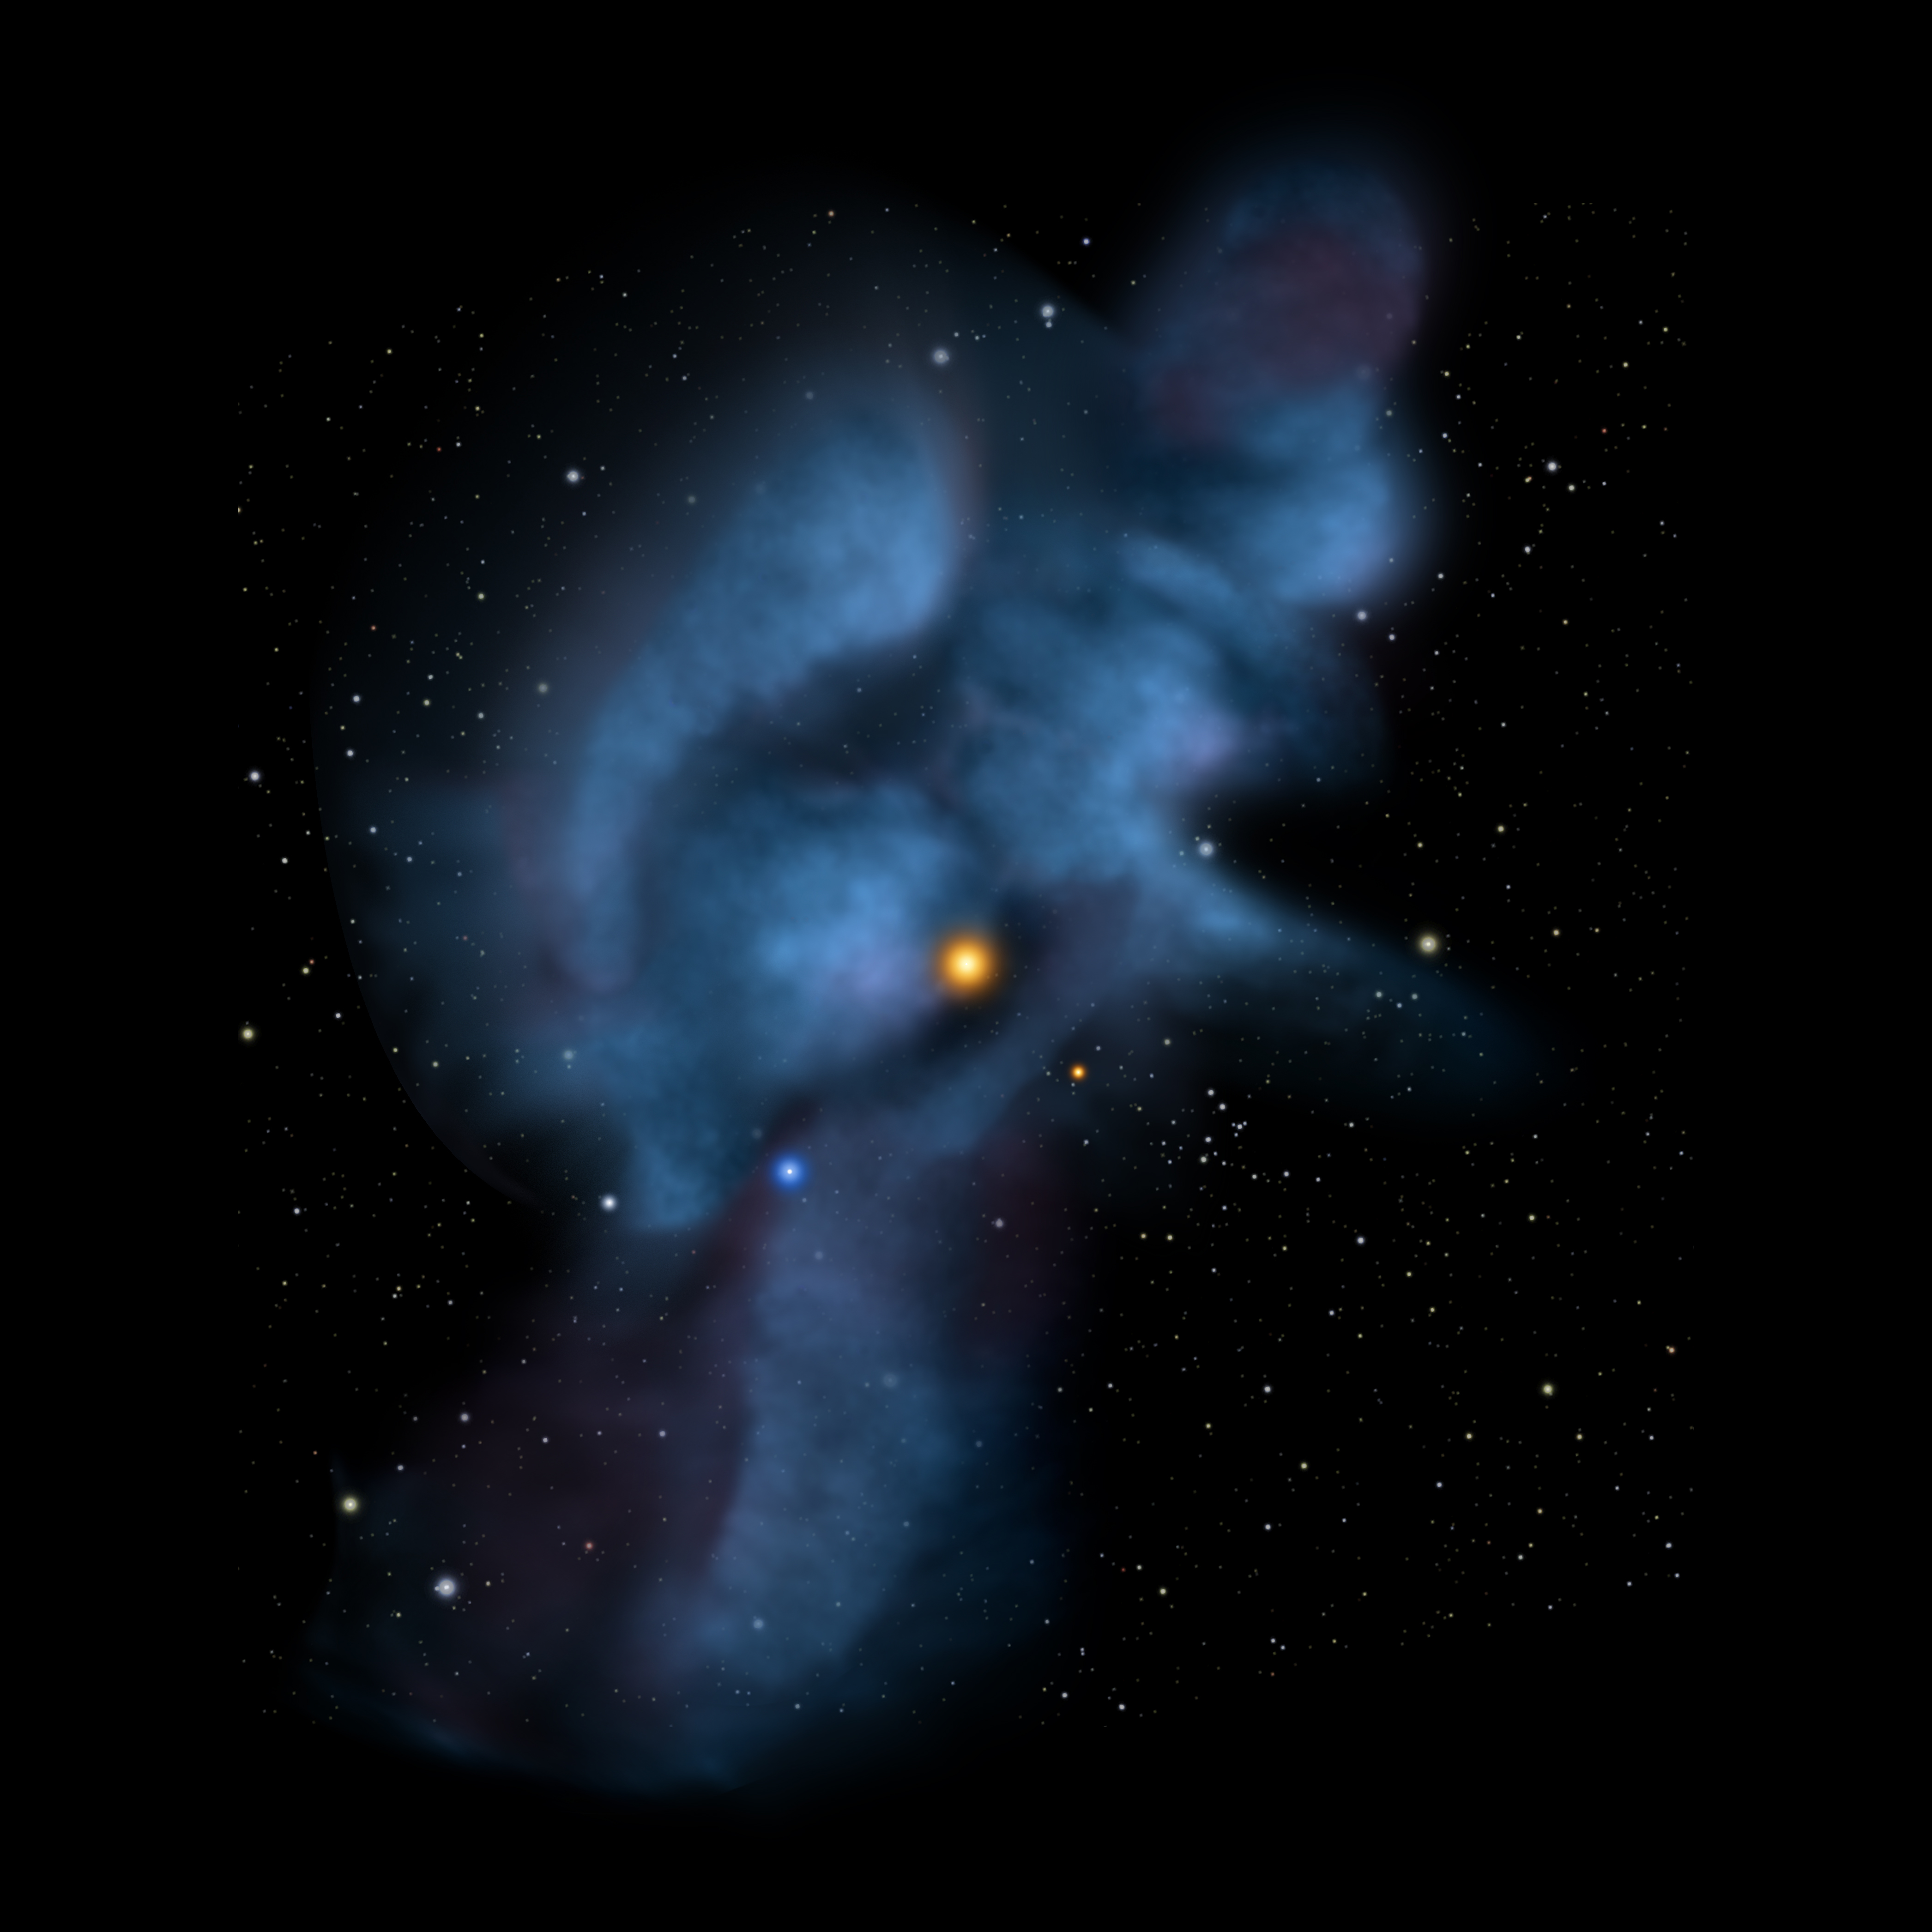
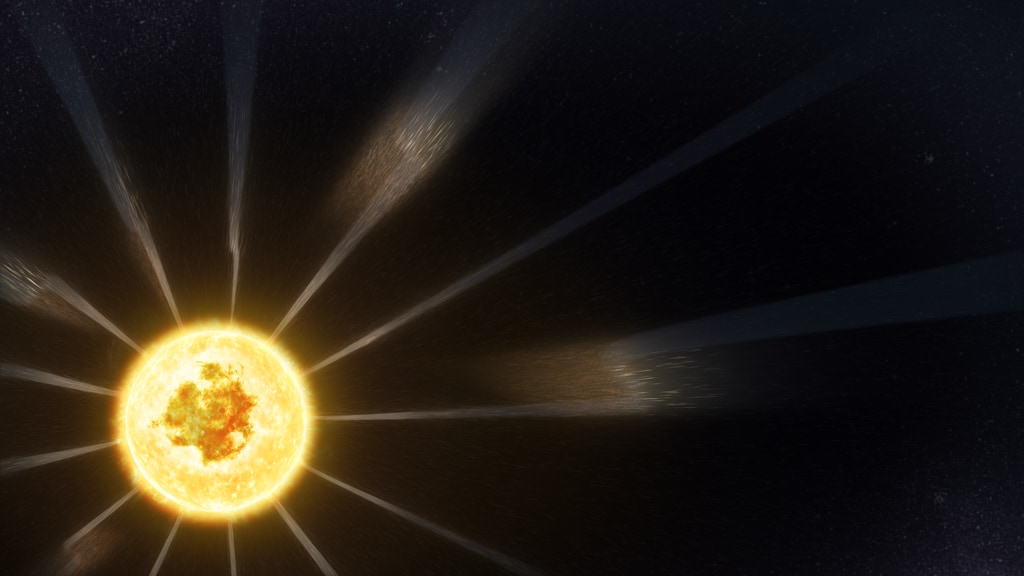
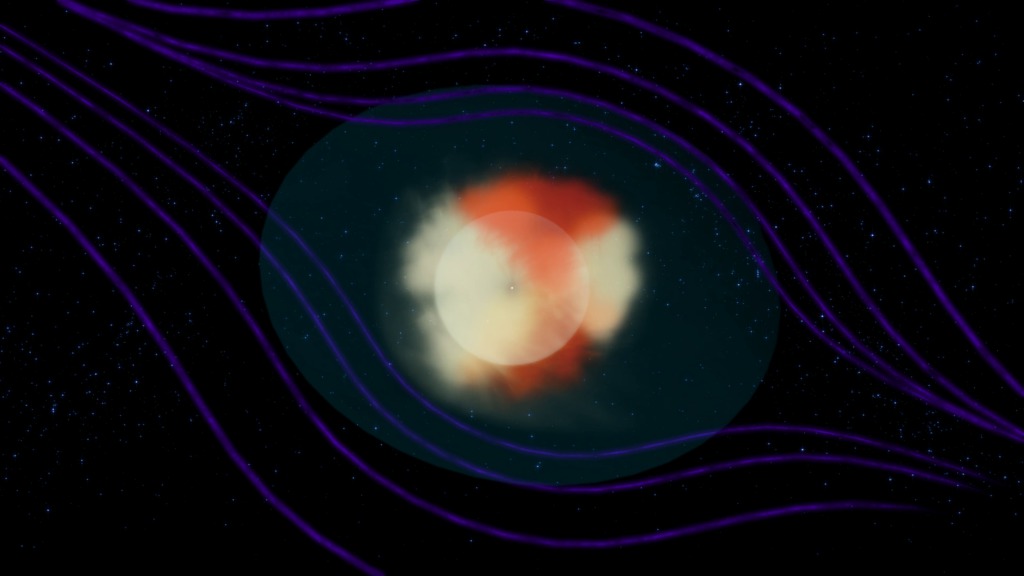
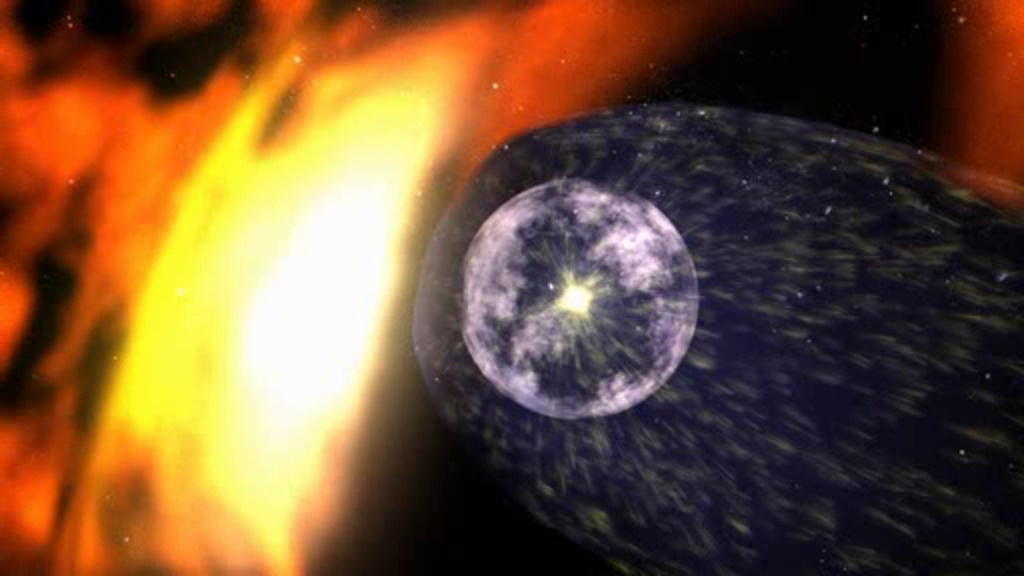
Far, far beyond the orbits of the planets lie the hazy outlines of the magnetic bubble in space that we call home.
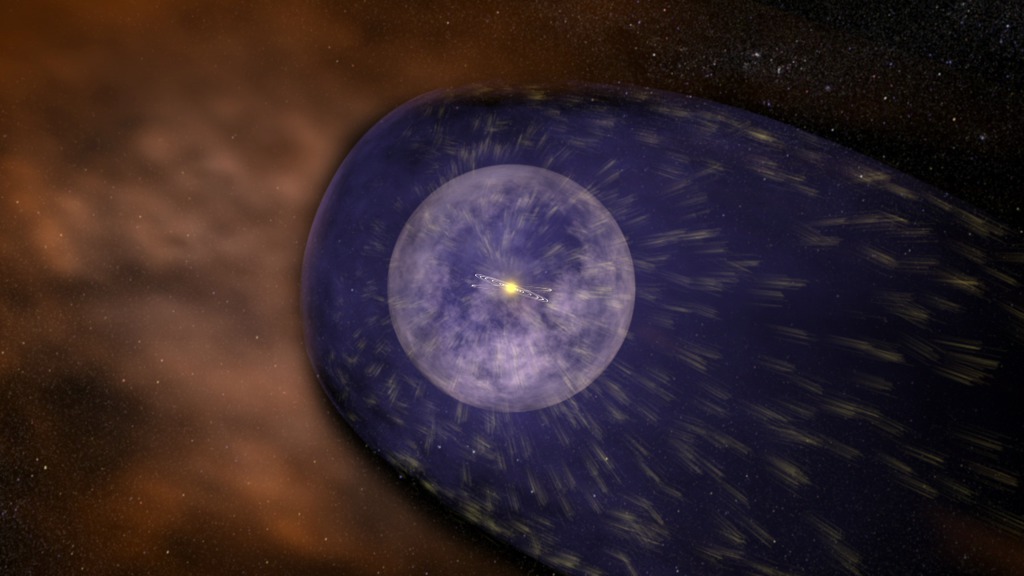
This is the heliosphere, the vast bubble that is generated by the Sun’s magnetic field and envelops all the planets. The borders of this cosmic bubble are not fixed. In response to the Sun’s gasps and sighs, they shrink and stretch over the years.
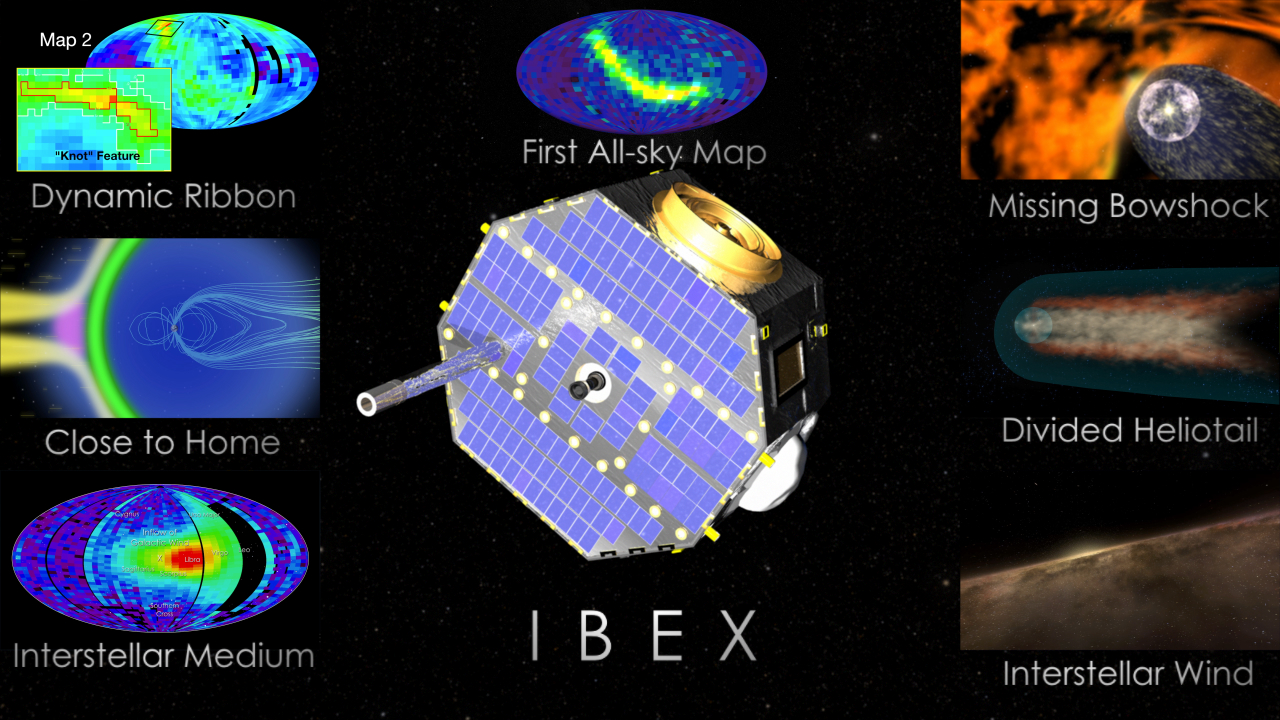
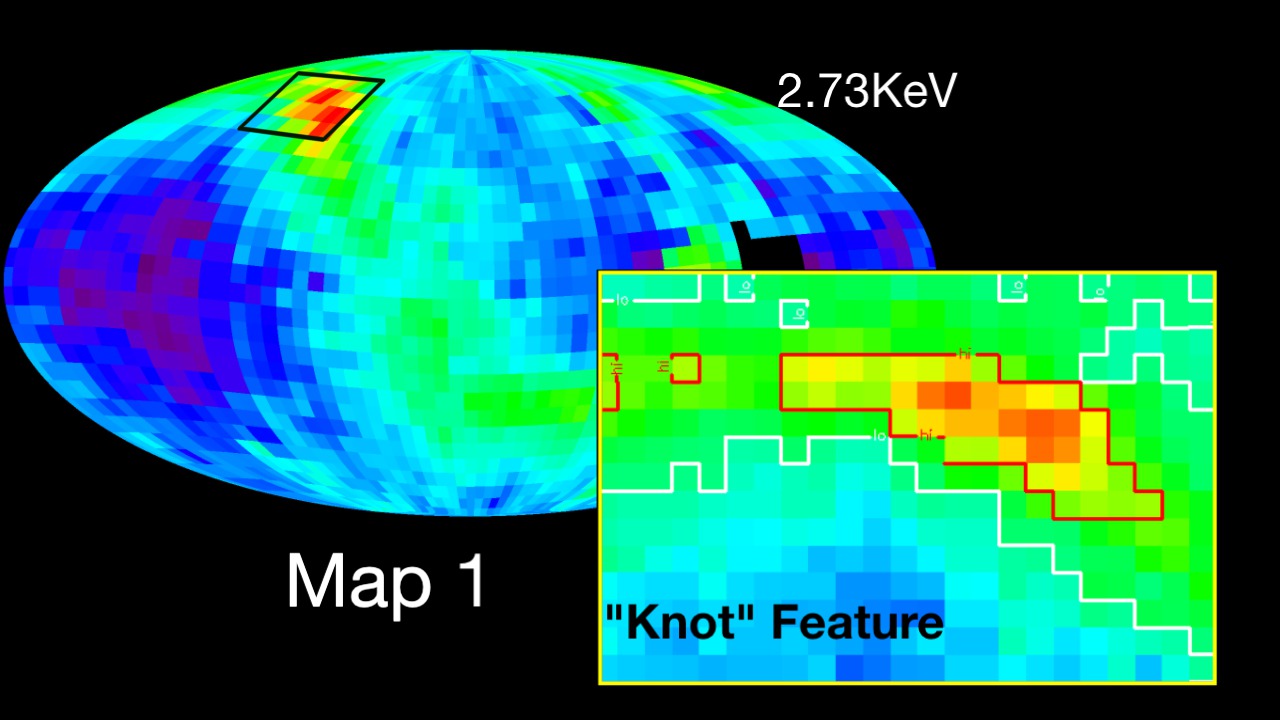
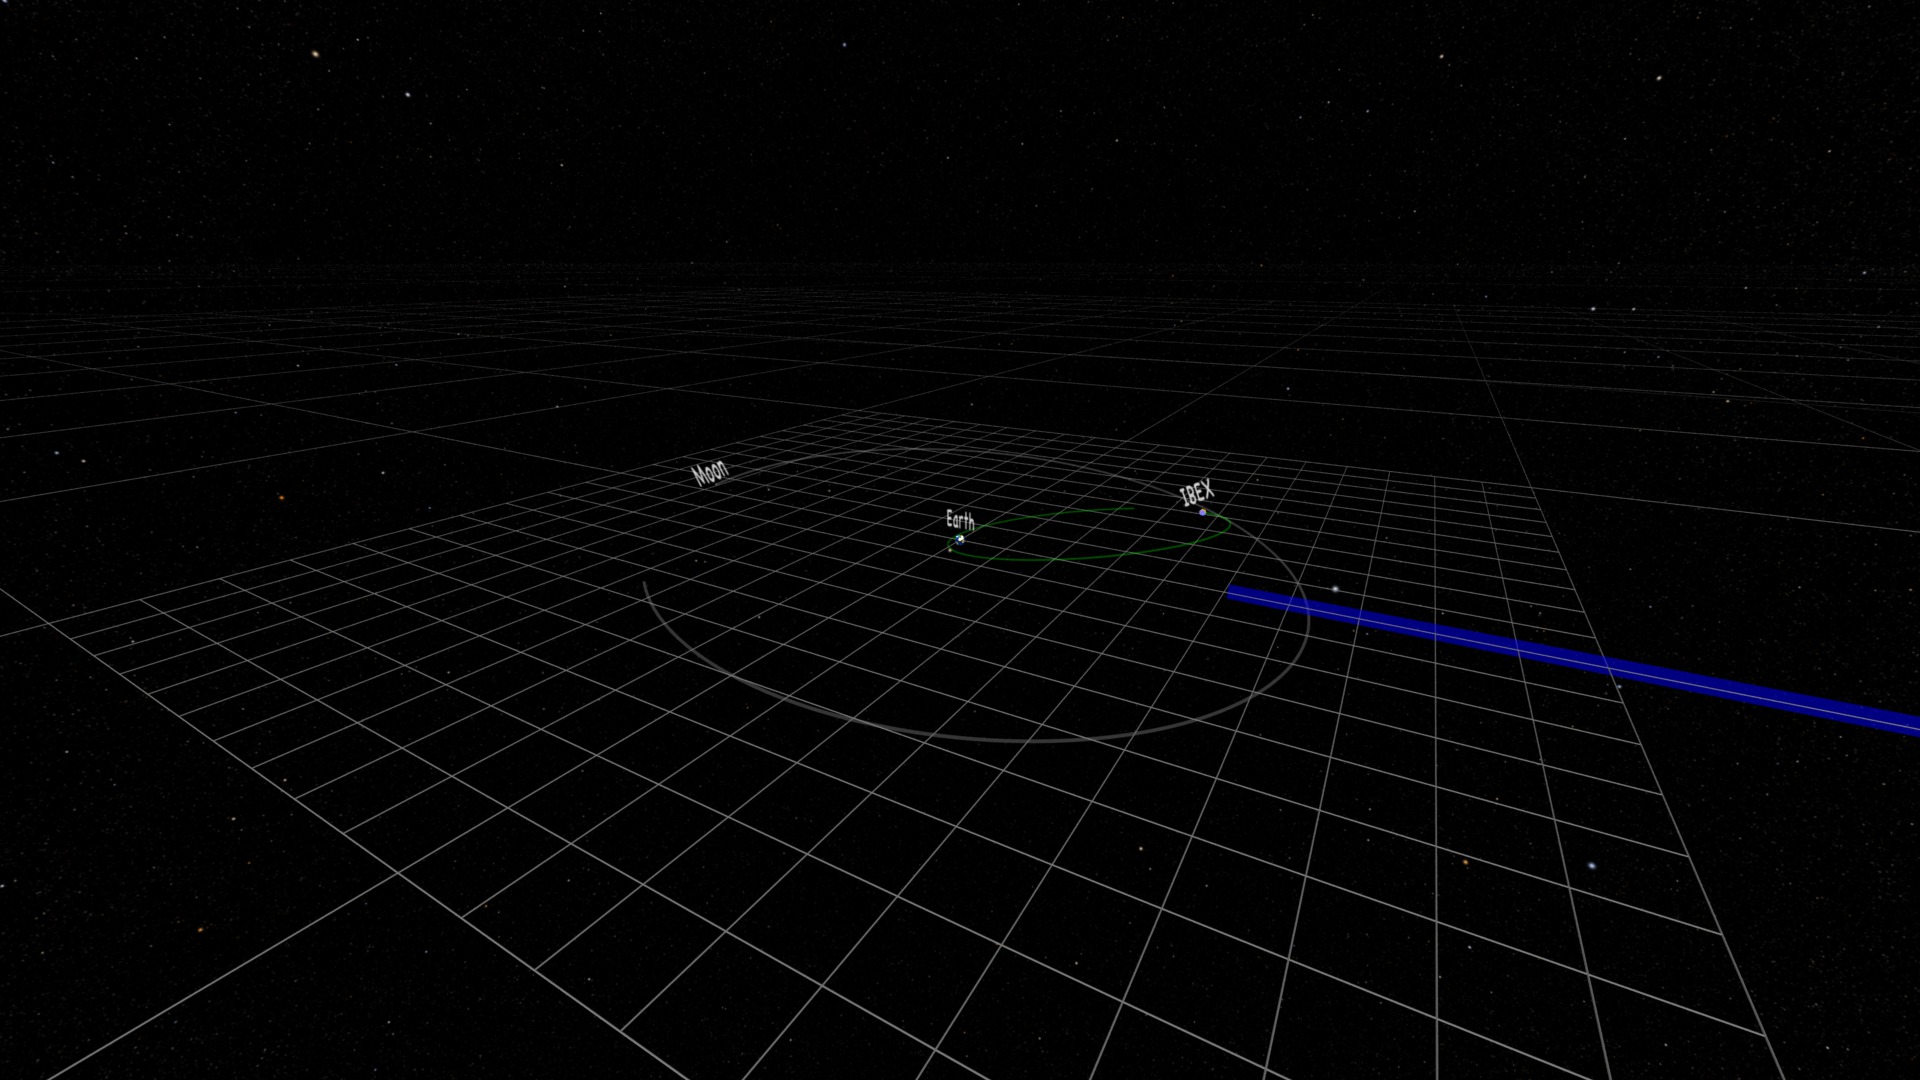
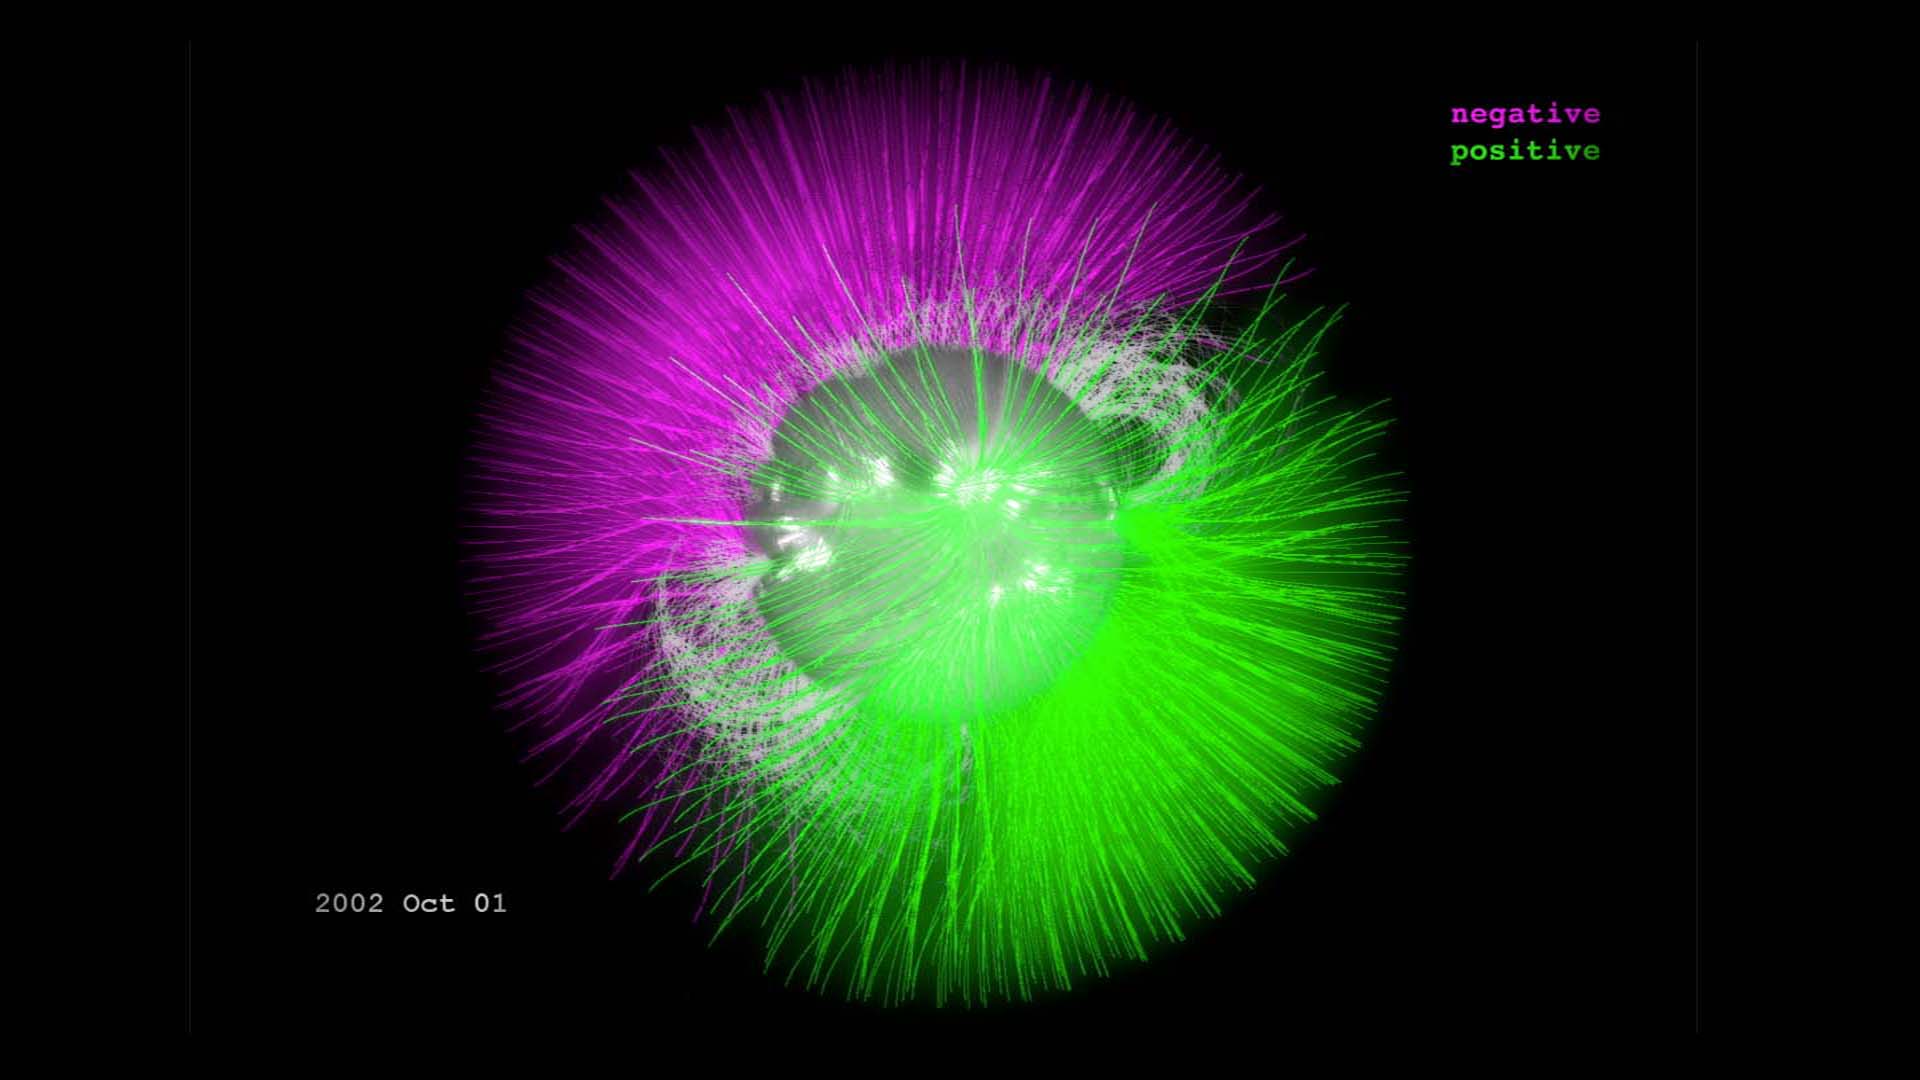
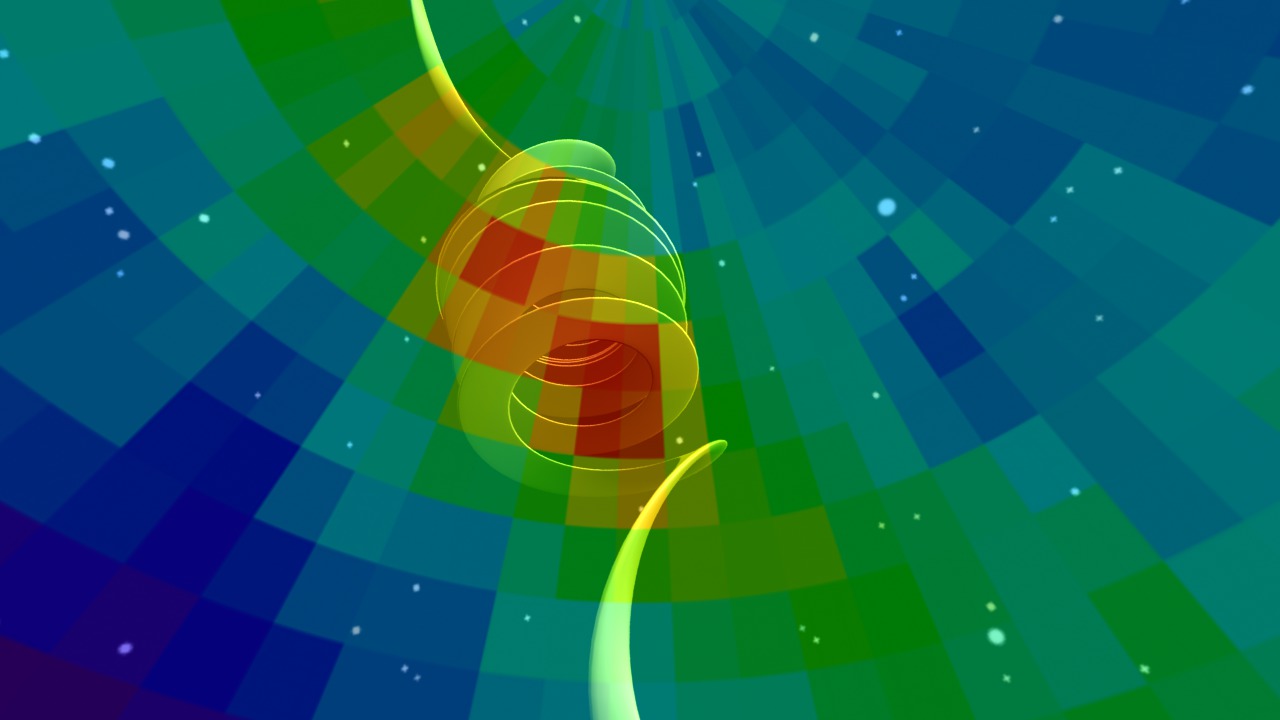
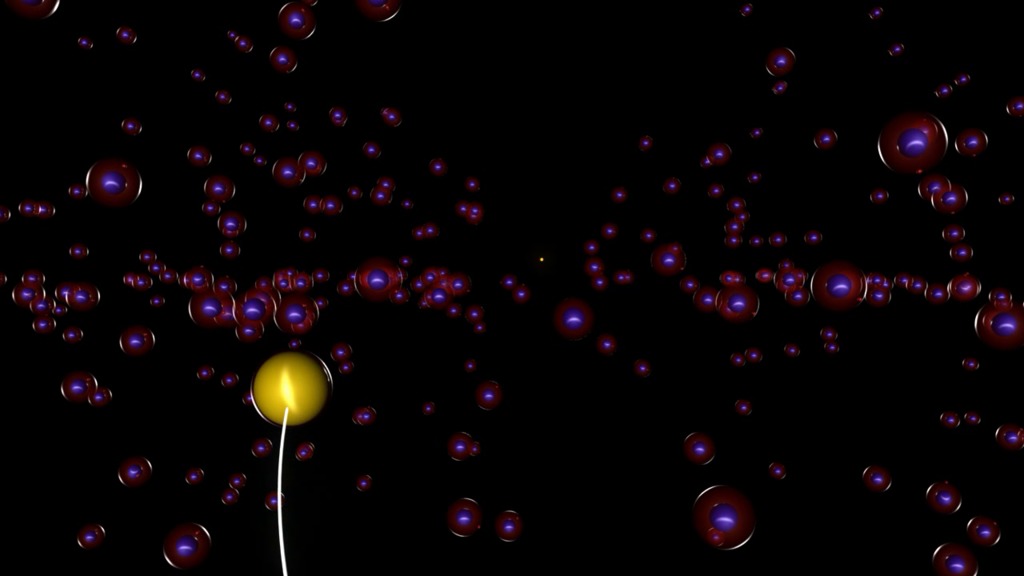
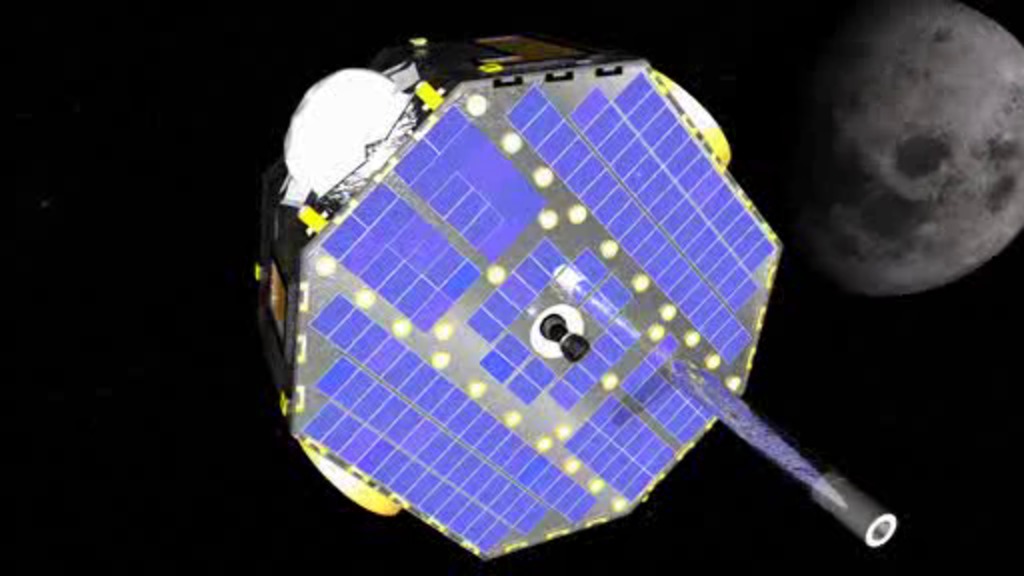
Now, for the first time, scientists have used an entire solar cycle of data from NASA’s IBEX spacecraft to study how the heliosphere changes over time. Solar cycles last roughly 11 years, as the Sun swings from seasons of high to low activity, and back to high again. With IBEX’s long record, scientists were eager to examine how the Sun’s mood swings play out at the edge of the heliosphere. The results show the shifting outer heliosphere in great detail, deftly sketch the heliosphere’s shape — a matter of debate in recent years, and hint at processes behind one of its most puzzling features. These findings, along with a newly fine-tuned data set, are published in The Astrophysical Journal Supplements on June 10, 2020.
Credits
Please give credit for this item to:
NASA's Goddard Space Flight Center. However, individual items should be credited as indicated above.
-
Producer
- Joy Ng (USRA)
-
Scientists
- Dave McComas (SwRI)
- Jamey Szalay (Princeton University)
- Eric Christian (NASA/HQ)
-
Animators
- Joy Ng (USRA)
- Walt Feimer (KBR Wyle Services, LLC)
- Krystofer Kim (USRA)
- Adriana Manrique Gutierrez (USRA)
- Jonathan North (USRA)
-
Data visualizer
- Tom Bridgman (Global Science and Technology, Inc.)
-
Writer
- Kathalina Tran (SGT)
-
Narrator
- Joy Ng (USRA)
Release date
This page was originally published on Thursday, June 11, 2020.
This page was last updated on Wednesday, May 3, 2023 at 1:44 PM EDT.
Missions
This visualization is related to the following missions:Series
This visualization can be found in the following series:Papers used in this visualization
https://iopscience.iop.org/article/10.3847/1538-4365/ab8dc2
Related
- ID: 14290
![Watch this video on the NASA Solar System Exploration Instagram page.Complete transcript available.Music credits: “Peaks and Spikes [Instrumental]” by Max van Thun [GEMA]](/vis/a010000/a014200/a014290/14290_HeliosphereRipples_YouTube.00001_print.jpg) Produced Video
Produced Video - ID: 11382
 Produced Video
 - ID: 10908
 Produced Video
 - ID: 10906
- ID: 10722
 Produced Video
 - ID: 10669
- ID: 3635
 Visualization
 - ID: 10351
 Produced Video
Sources
- ID: 20299
 Animation
 - ID: 11429
 Produced Video
 - ID: 20200
 Animation
 - ID: 10905
 Produced Video
 - ID: 20185
 Animation
 - ID: 3770
 Visualization
 - ID: 10332
 Produced Video
 - ID: 3514
 Visualization
 - ID: 20134
 Animation
 - ID: 20131
 Animation