NASA Models Methane Sources and Movement Around the Globe
Complete transcript available.
Music: "Reported Missing" by Andrew Michael Britton [PRS] and David Stephen Goldsmith [PRS]
This video can be freely shared and downloaded. While the video in its entirety can be shared without permission, some individual imagery provided by Artbeats is obtained through permission and may not be excised or remixed in other products. Specific details on stock footage may be found here. For more information on NASA’s media guidelines, visit https://www.nasa.gov/multimedia/guidelines/index.html.
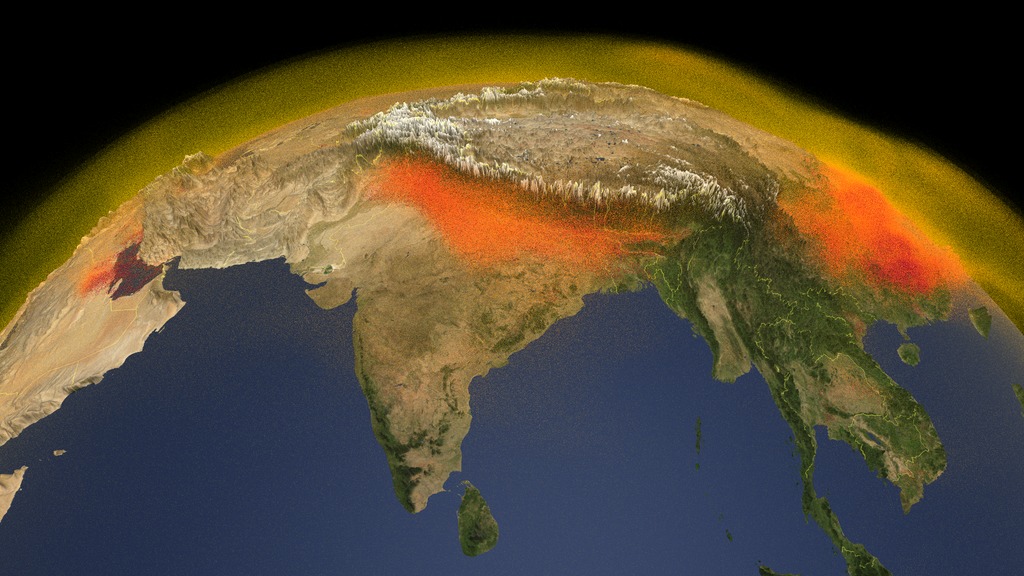
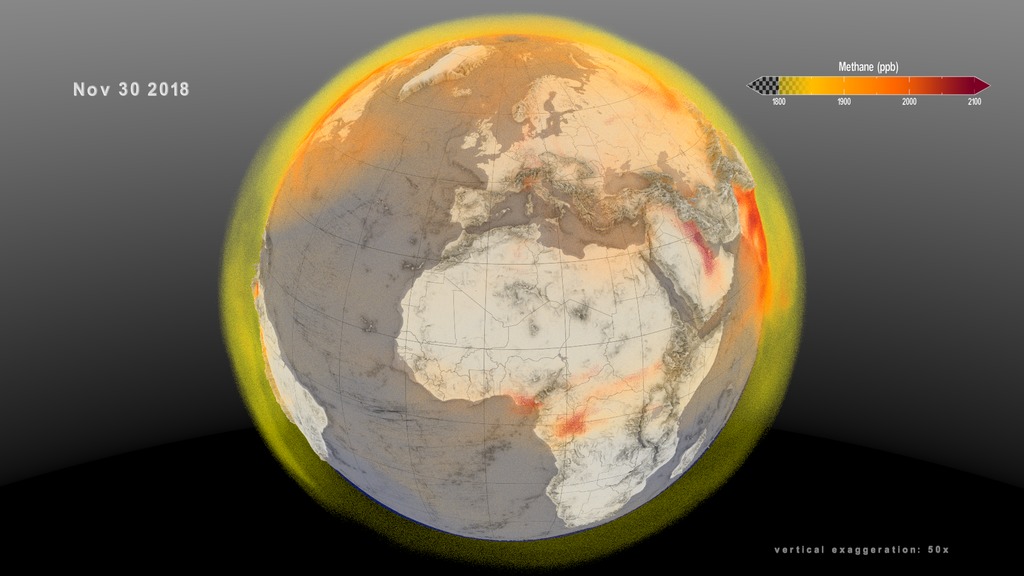
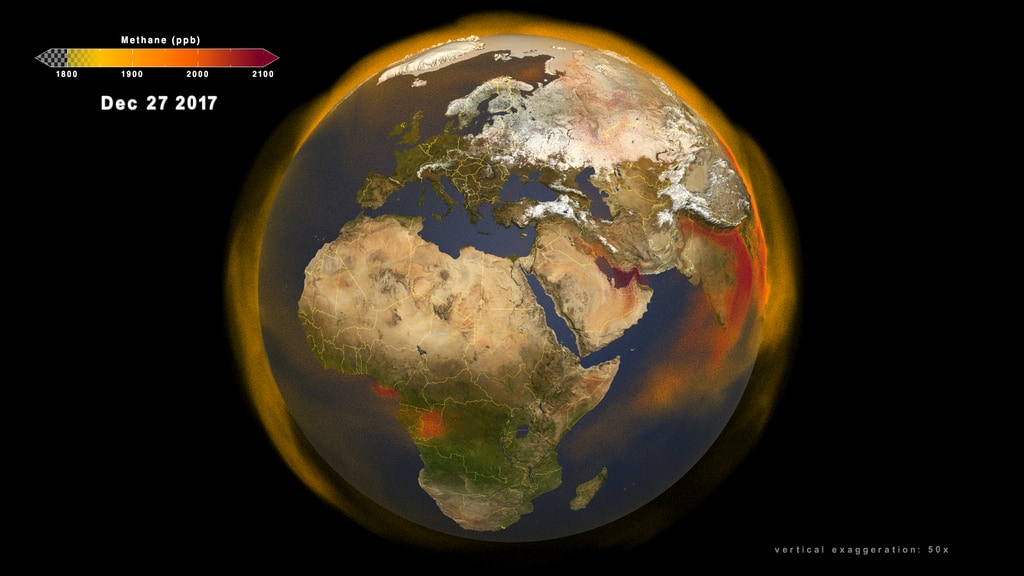
NASA’s new 3-dimensional portrait of methane shows the world’s second largest contributor to greenhouse warming as it travels through the atmosphere.
Combining multiple data sets from emissions inventories and simulations of wetlands into a high-resolution computer model, researchers now have an additional tool for understanding this complex gas and its role in Earth’s carbon cycle, atmospheric composition, and climate system.
The new data visualization builds a fuller picture of the diversity of methane sources on the ground as well as the behavior of the gas as it moves through the atmosphere.
Credits
Please give credit for this item to:
NASA's Goddard Space Flight Center
-
Producer
- Katie Jepson (USRA)
-
Writer
- Ellen T. Gray (ADNET Systems, Inc.)
-
Visualizers
- Cindy Starr (Global Science and Technology, Inc.)
- Trent L. Schindler (USRA)
- Greg Shirah (NASA/GSFC)
-
Scientists
- Lesley Ott (NASA/GSFC)
- Benjamin Poulter (NASA/GSFC)
- Abhishek Chatterjee (USRA)
-
Videographer
- John Caldwell (Advocates in Manpower Management, Inc.)
-
Animator
- Vuk Nikolic (Freelance)
-
Narrator
- Katie Jepson (USRA)
-
Editor
- Katie Jepson (USRA)
-
Technical support
- Aaron E. Lepsch (ADNET Systems, Inc.)
Release date
This page was originally published on Monday, March 23, 2020.
This page was last updated on Wednesday, May 3, 2023 at 1:45 PM EDT.
Series
This visualization can be found in the following series:Related
- ID: 4799
 Visualization
 - ID: 4798
 Visualization
Sources
- ID: 4789
 Visualization