New Mission Will Take First Peek at Sun’s Poles
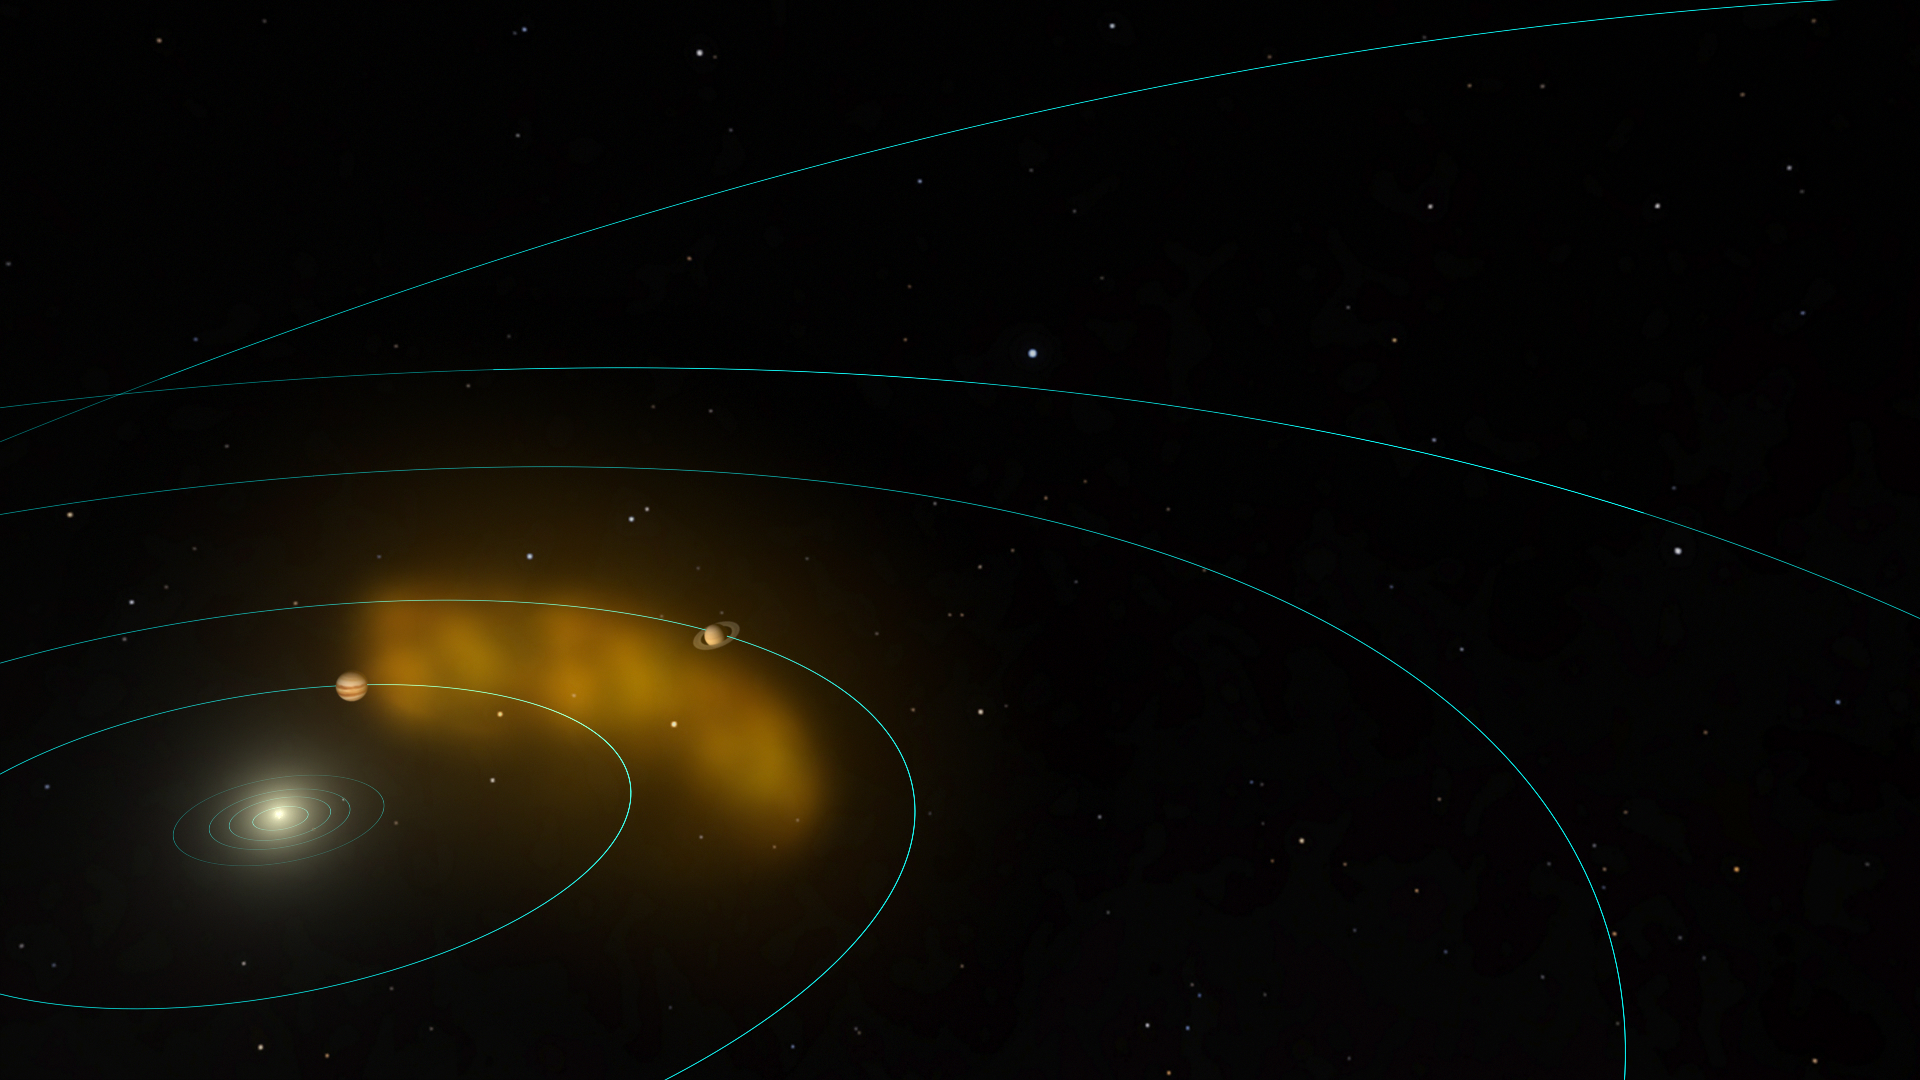
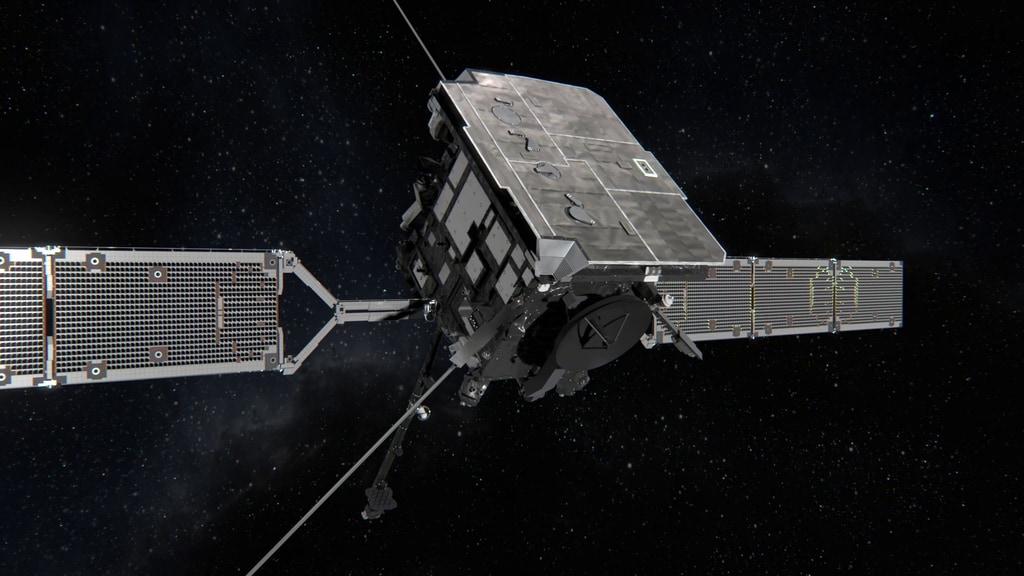
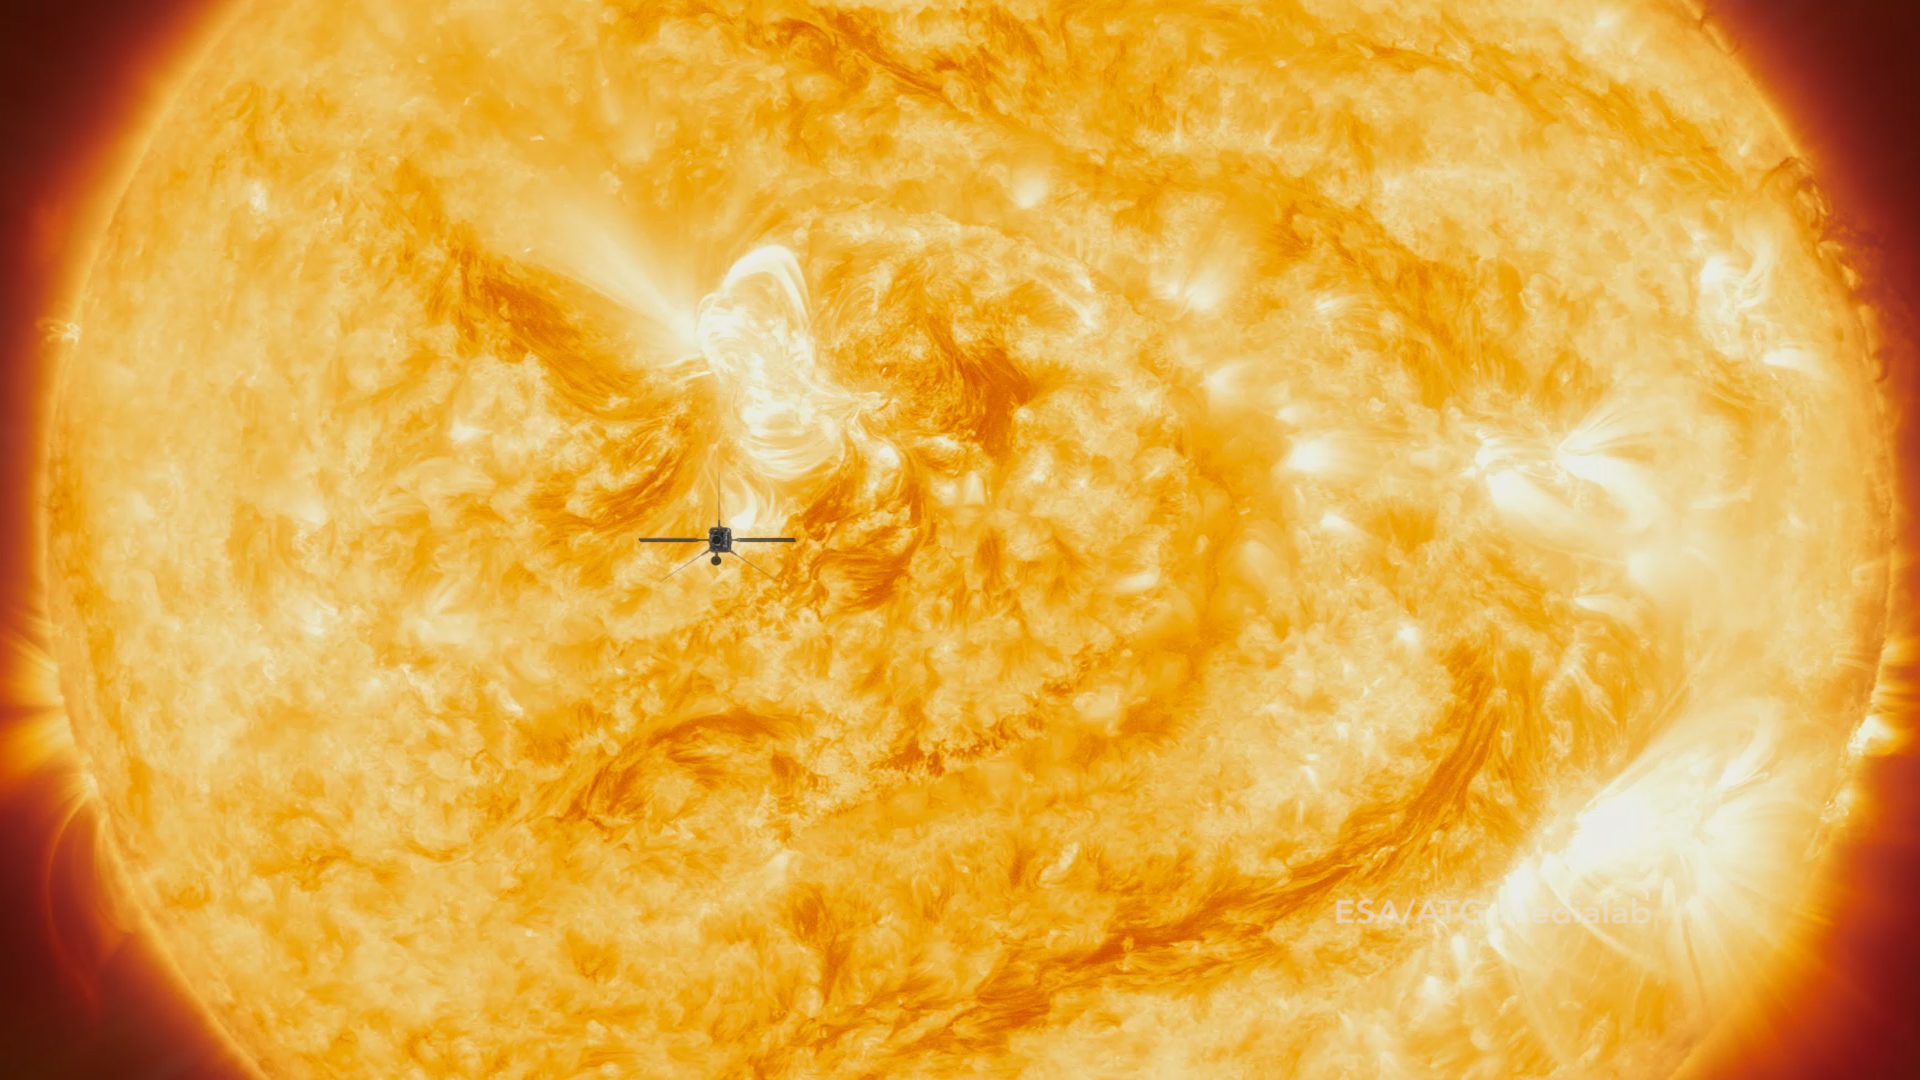
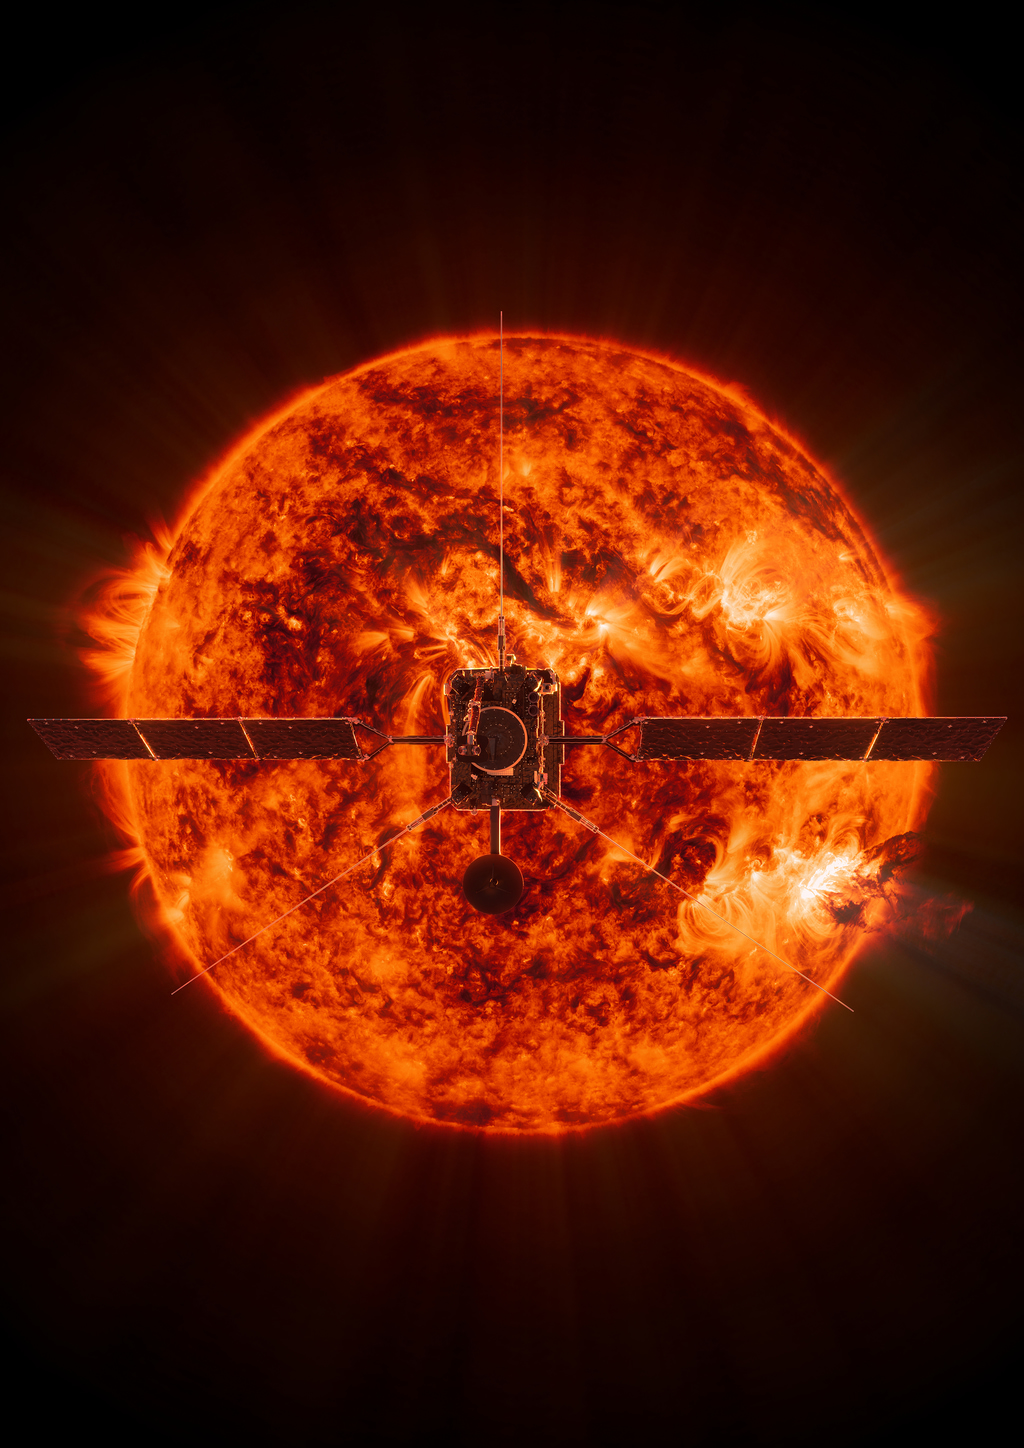
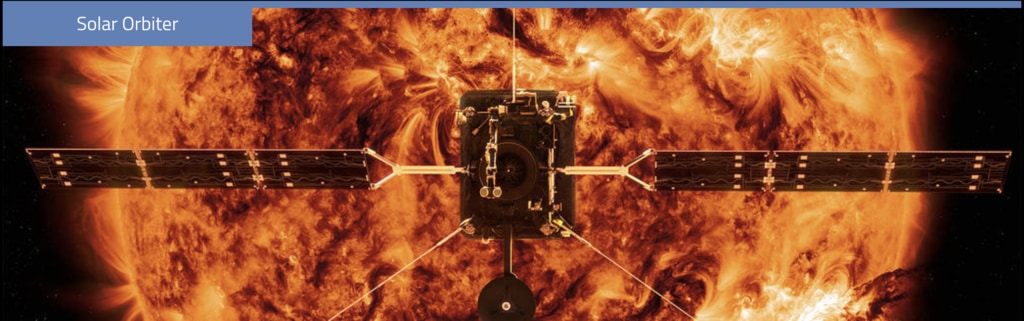
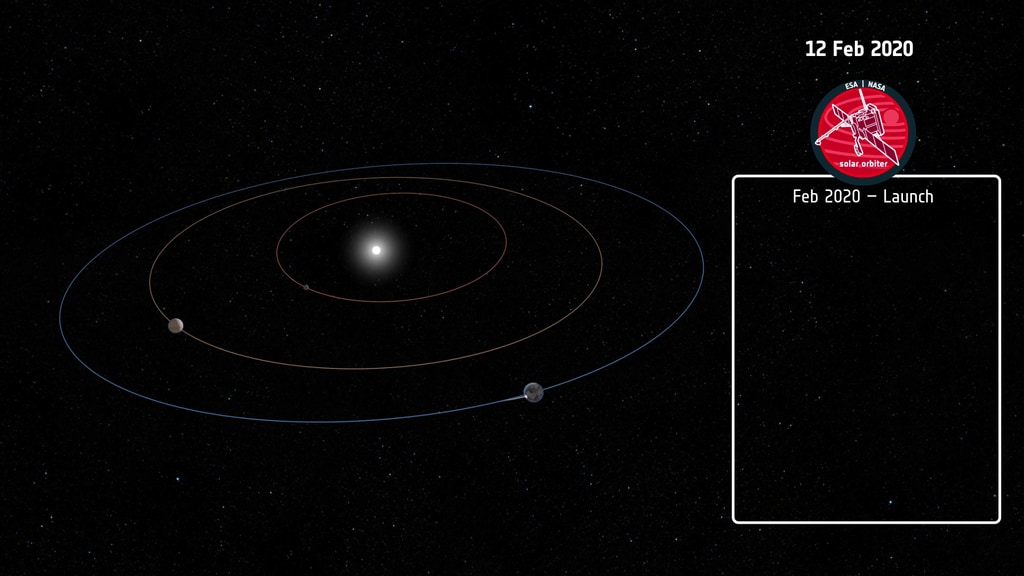
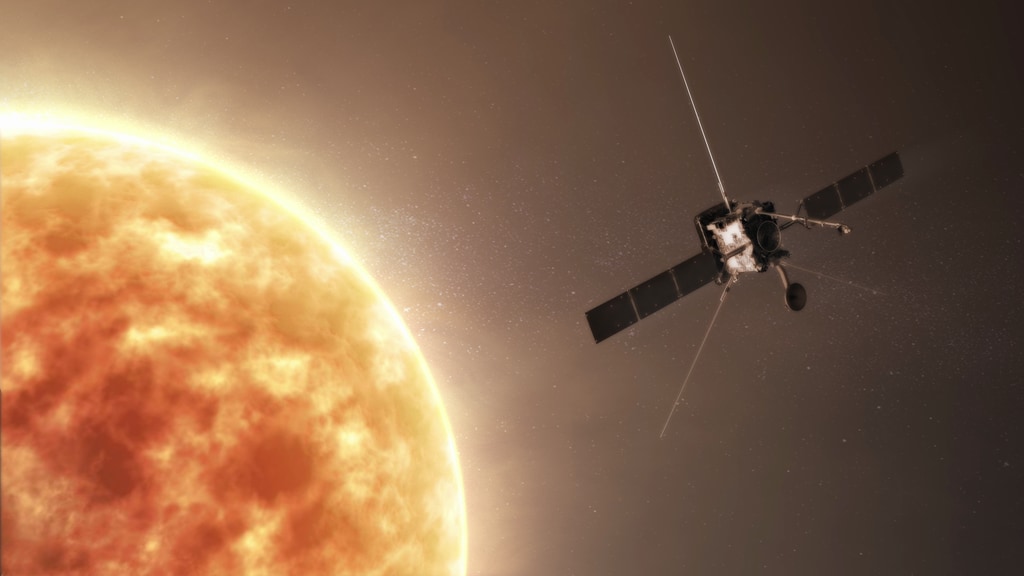
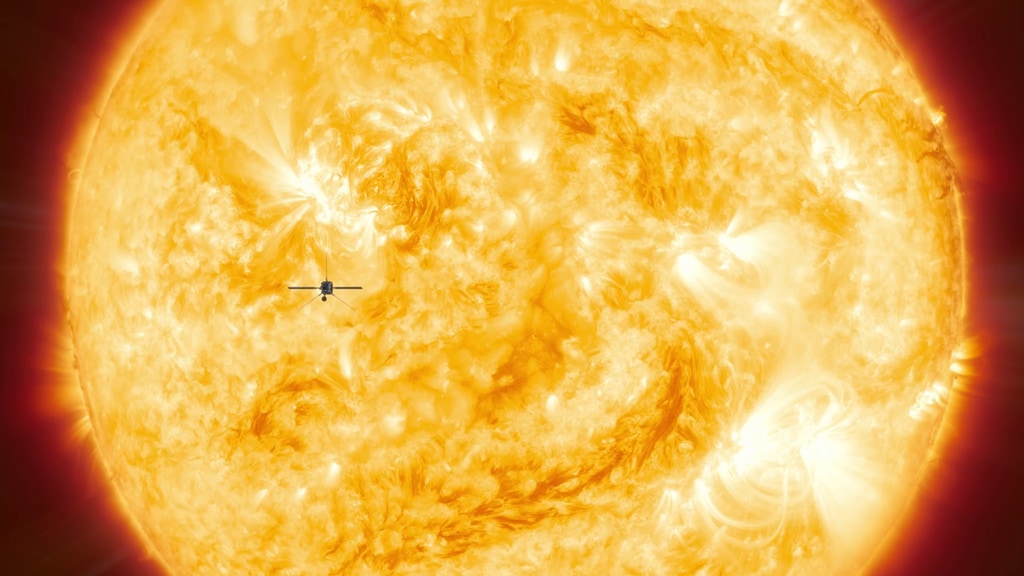
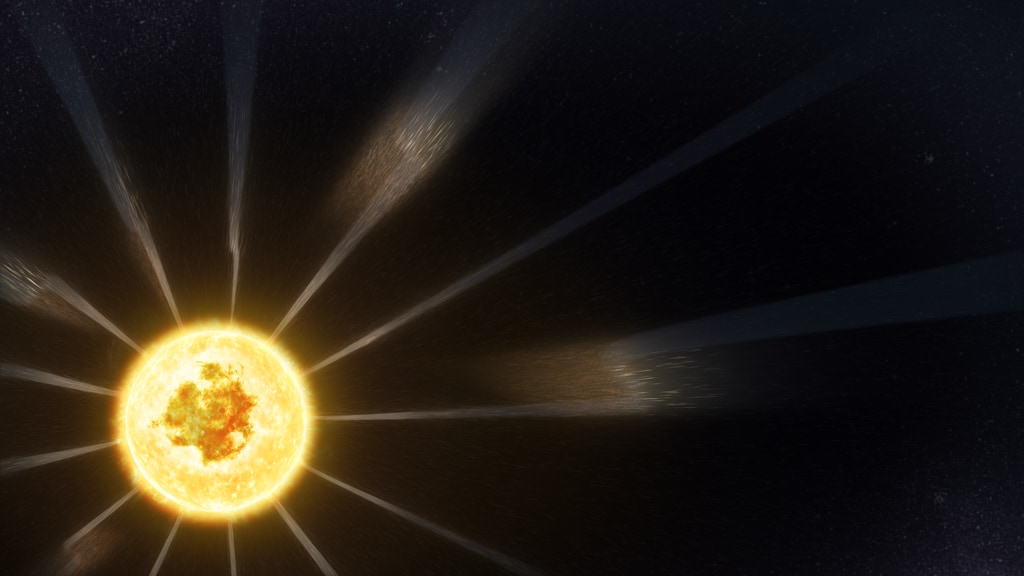
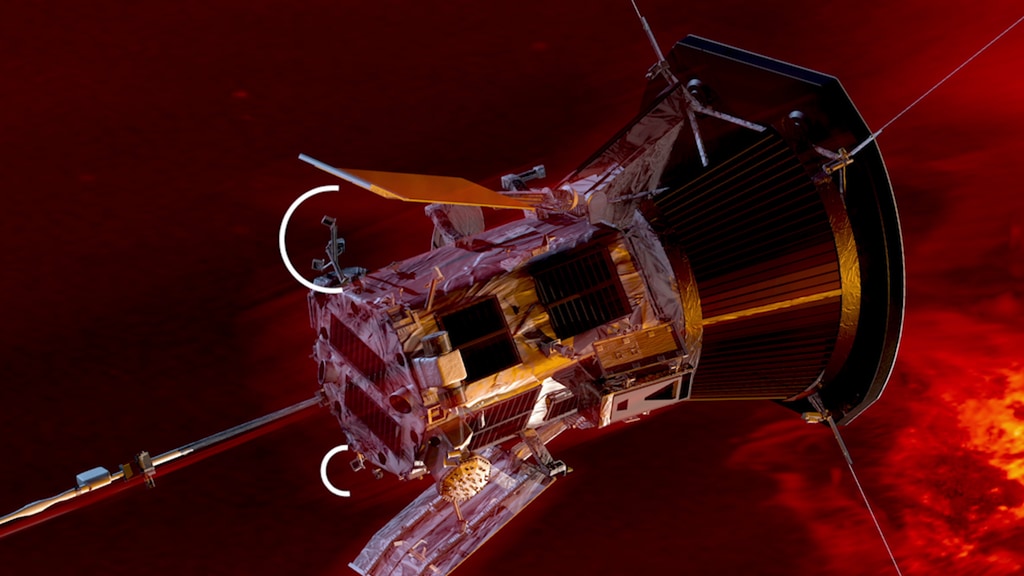
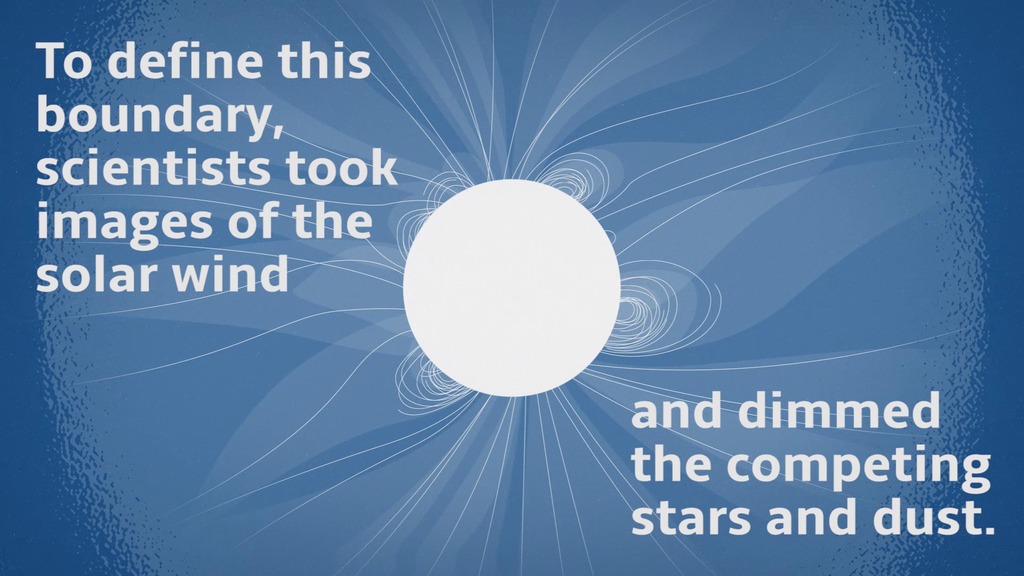
Read more: https://www.nasa.gov/feature/goddard/2020/new-mission-will-take-first-peek-at-sun-s-poles
Movies
- 13537_SolarOrbiterOverview_Facebook.mp4 (1920x1080) [279.3 MB]
- 13537_SolarOrbiterOverview_Twitter.mp4 (1920x1080) [50.7 MB]
- 13537_SolarOrbiterOverview_YouTube.mp4 (1920x1080) [372.2 MB]
- 13537_SolarOrbiterOverview_YouTube.webm (1920x1080) [25.9 MB]
- 13537_SolarOrbiterOverview_Prores.mov (1920x1080) [2.4 GB]
Captions
- SolarOrbiter.en_US.srt [4.3 KB]
- SolarOrbiter.en_US.vtt [4.3 KB]
Images
- 13537_SolarOrbiterOverview_YouTube.00725_print.jpg (1024x576) [50.1 KB]
- 13537_SolarOrbiterOverview_YouTube.00725_thm.png (80x40) [5.0 KB]
- 13537_SolarOrbiterOverview_YouTube.00725_searchweb.png (320x180) [61.4 KB]
- 13537_SolarOrbiterOverview_YouTube.00725_web.png (320x180) [61.4 KB]
Video
Watch this video on the NASA Goddard YouTube channel.
Music credits: “Oxide” and “Virtual Tidings” by Andrew Michael Britton [PRS], David Stephen Goldsmith [PRS]; “Progressive Practice” by Emmanuel David Lipszc [SACEM], Franck Lascombes [SACEM], Sebastien Lipszyc [SACEM]; “Political Spectrum” by Laurent Dury [SACEM} from Universal Production Music
Complete transcript available.

Still Image
Credit: NASA/CiLab
Credits
Please give credit for this item to:
NASA's Goddard Space Flight Center
Animators
- Adriana Manrique Gutierrez (KBRwyle)
- Brian Monroe (USRA)
- Chris Smith (KBRwyle)
- Joy Ng (KBRwyle)
- Krystofer Kim (KBRwyle)
- Lisa Poje (USRA)
Data visualizer
- Tom Bridgman (GST)
Writer
- Miles S. Hatfield (Telophase)
Scientists
- Chris St. Cyr (NASA/GSFC)
- Daniel Mueller (ESA)
- Holly Gilbert (NASA/GSFC)
- Teresa Nieves-Chinchilla (Catholic University of America)
Producer
- Joy Ng (KBRwyle)
Videographers
- John Caldwell (AIMM)
- Rob Andreoli (AIMM)
Missions
This visualization is related to the following missions:Series
This visualization can be found in the following series:Related pages
Solar Orbiter Science Press Briefing
Feb. 7th, 2020
Read moreDuring its closest approaches of the Sun, Solar Orbiter will travel fast enough to study how magnetically active regions evolve for up to four weeks at a time. Solar Orbiter will return the first images and measurements of the Sun’s polar magnetic field, helping scientists relate the poles to the solar activity cycle.Credit: ESA/ATG Medialab Solar Orbiter orbiting the Sun. Over its seven-year mission, the spacecraft will go as close as 26 million miles from the Sun.Credit: NASA's Goddard Space Flight Center/Conceptual Image Lab/Adriana Manrique Gutierrez This animation of Solar Orbiter and its instruments begins by showing small sliding doors in the heat shield open to allow the internally mounted, remote-sensing instruments to observe the Sun. Special windows block out heat to protect the instruments during operations. The doors are closed when the remote-sensing instruments are not observing. The in situ instruments are in science mode throughout the spacecraft’s orbit.Credit: ESA/ATG Medialab Animation of the solar wind, the stream of charged particles that constantly blows from the Sun. Solar activity shapes space throughout the solar system, and has profound effects on our home planet.Credit: NASA's Goddard Space Flight Center Animation of a spacecraft experience damage from space weather. Sometimes, solar eruptions can disrupt satellites and everyday technology such as GPS and radio. At worst, space weather can also impact astronauts.Credit: NASA’s Goddard Space Flight Center/Conceptual Image Lab/Krystofer Kim A solar eruption bursts from the Sun, as seen by NASA’s Solar Dynamics Observatory. Credit: NASA's Goddard Space Flight Center/SDO This visualization presents a model of the Sun’s magnetic field based on solar observations. Currently, scientists lack measurements of the magnetic field at the Sun’s north and south poles. Solar Orbiter will fly in an inclined orbit in order to study the poles. Credit: NASA's Scientific Visualization Studio/Tom Bridgman Animation showing the deployment of the boom and antennas. Solar Orbiter carries a comprehensive suite of 10 instruments that take both in situ and remote measurements.Credit: ESA/ATG Medialab Animation of a coronal mass ejection impacting Mars, Earth, and Jupiter. Solar Orbiter is equipped to image such eruptions as they burst from the Sun, and measure the eruption directly as it passes the spacecraft.Credit: NASA’s Goddard Space Flight Center/Conceptual Image Lab/Bailee DesRocher Image of NASA’s heliophysics observatory fleet. Credit: NASA Image of the European Space Agency’s solar system explorers. Credit: ESA Animation of the Artemis program’s lunar lander concept. Credit: NASA NASA and the European Space Agency (ESA) will present Solar Orbiter, the ESA/NASA mission to the Sun, during a science press briefing on Friday, Feb. 7. 2020, at 2.30 p.m. EST. Solar Orbiter will observe the Sun with high spatial resolution telescopes and capture observations in the environment directly surrounding the spacecraft to create a one-of-a-kind picture of how the Sun can affect the space environment throughout our solar system. The spacecraft also will provide the first-ever images of the Sun’s poles and the never-before-observed magnetic environment there, which helps drive the Sun’s 11-year solar cycle and its periodic outpouring of solar storms.The teleconference audio will stream live at:https://www.nasa.gov/liveParticipants include:European Space Agency• Daniel Müller, Solar Orbiter Project Scientist• Günther Hasinger, Director of ScienceNASA• Nicky Fox, Heliophysics Division Director, NASA HQ• Thomas Zurbuchen, Associate Administrator for the Science Mission Directorate, NASA HQ For More InformationSee [https://www.nasa.gov/press-release/nasa-to-broadcast-solar-orbiter-launch-prelaunch-activities](https://www.nasa.gov/press-release/nasa-to-broadcast-solar-orbiter-launch-prelaunch-activities) Related pages
The Solar Polar Magnetic Field
Feb. 4th, 2020
Read moreThis movie gives a view starting at equator and tipping to a view of the north heliographic pole (the blue axis) then dipping down to the south heliographic pole. Closed field lines are white/grey, green and violet lines represent field lines that are considered 'open'. Green represents positive magnetic polarity, and violet represents negative polarity. The dark rings around the blue polar axis show the region where the solar surface magnetic field must be generated from a model. This region grows and shrinks depending on SDOs position in its orbit around the Sun and Earth (above and below the solar equator, which is tilted by 7.25 degrees relative to Earth's orbital plane). This movie has a view (roughly) from the position of SDO. The polar gap rings are not shown on these. This movie has a view a fixed solar longitude so the Sun does not appear to rotate. The polar gap rings are not shown on these. From our single vantage point of Earth, our view of the Sun is never complete. While the far-side of the Sun eventually rotates into view, coverage of the Sun's polar regions is never satisfactory as perspective effects either completely block our view or create a distorted view. We must often resort to computer modeling of these solar polar regions.This visualization presents the Potential Field Source Surface (PFSS) magnetic field model based on solar observations covering the years 2017-2019. One version also presents the 'hole' in our measurements of the solar polar region. The region oscillates in size over the course of the year due to the changing perspective created by the tilt of Earth's orbital plane with the solar equator. In this region, researchers must resort to approximations to build a more complete view of the solar magnetic field.Why is the solar magnetic field in this region important? Because the combined with the outgoing flow of the solar wind, the magnetic field lines from the polar regions curve up, and then back down to near the Sun's equatorial plane, which is still fairly close to the orbital plane of Earth and other planets in our solar system. This gives the Sun's polar magnetic field a significant influence on the space weather impacting Earth and crewed and uncrewed assets around the solar system. Related pages
Solar Orbiter Trailer - Videos in English and Spanish
Feb. 4th, 2020
Read moreMusic: Find Her by Yuri SazonoffAnimation by ESA/ATG MedialabWatch this video on the NASA Goddard YouTube channel.Complete transcript available. Música: Find Her, por Yuri SazonoffAnimación por ESA/ATG MedialabMira este vídeo en el canal de YouTube de la NASA en español.La transcripción completa Solar Orbiter is the ESA/NASA collaboration soon to start its journey to the Sun. Solar Orbiter has uniquely tilted orbit that will enable it to capture the first images of the Sun’s North and South poles and tackle major solar mysteries with its comprehensive suite of ten different instruments.Solar Orbiter es una colaboración de ESA y NASA que pronto empezará su viaje hacia el Sol. Solar Orbiter tiene una órbita inclinada única que le permitirá capturar las primeras imágenes de los polos norte y sur del Sol y abordar grandes misterios solares con su completo conjunto de diez instrumentos. Related pages
Solar Orbiter Graphics
Feb. 3rd, 2020
Read moreCredit: ESA/ATG medialab Credit: ESA/ATG medialab Credit: ESA/ATG medialab Credit: ESA/ATG medialab Credit: ESA/ATG medialab Credit: ESA/ATG medialab Instruments on Solar Orbiter. Credit: ESA/ATG medialab Solar Orbiter factsheet. Credit: ESA/ATG medialab Solar Orbiter factsheet. Credit: ESA/ATG medialab Credit: ESA/ATG medialab Solar Orbiter with an alpha channel.Credit: ESA/ATG medialab Solar Orbiter with an alpha channel.Credit: ESA/ATG medialab Solar Orbiter with an alpha channel.Credit: ESA/ATG medialab Solar Orbiter with an alpha channel.Credit: ESA/ATG medialab Solar Orbiter with an alpha channel.Credit: ESA/ATG medialab Solar Orbiter with an alpha channel.Credit: ESA/ATG medialab Solar Orbiter with an alpha channel.Credit: ESA/ATG medialab Solar Orbiter with an alpha channel.Credit: ESA/ATG medialab Solar Orbiter with an alpha channel.Credit: ESA/ATG medialab Solar Orbiter with an alpha channel.Credit: ESA/ATG medialab Solar Orbiter with an alpha channel.Credit: ESA/ATG medialab Related pages
The Countdown is on for Launch of NASA’s Next Mission to Face the Sun Live Shots
Jan. 31st, 2020
Read moreB-roll and canned interviews will be added by Thursday at 4:00 p.m. ESTSolar Orbiter Will Give Humanity Its First Close-Up Look At The Sun’s Poles B-roll Package Canned interview with Dr. Alex Young looking straight into the camera. Canned interview with Dr. Alex Young looking off camera NASA’s Next Great Adventure to the Sun Launches Next Week New Mission Will Broaden Understanding of Sun and Future Space ExplorationNext week, NASA will launch a daring new mission to the Sun that will give us the most comprehensive view yet of our star. Solar Orbiter is a joint European Space Agency (ESA) and NASA mission that will provide high-resolution views of the never-before-seen poles of the Sun. The mission will help answer some of our most burning questions about the Sun, with implications for how to best protect our technology and astronauts going to the Moon and beyond.On Friday, Feb. 7 from 6:00 a.m. - 1:00 p.m. EST, NASA and ESA scientists are available LIVE from Kennedy Space Center to give your viewers a look into this exciting mission as it prepares to face the Sun. Find out how understanding the Sun better will ultimately help NASA send the first woman and next man forward to the Moon with the Artemis program. * Solar Orbiter is set to launch on Sunday, Feb. 9 at 11:03 p.m. EST.* We've studied the Sun for decades, but there is still more to learn about the center of our solar system. Solar Orbiter’s images of the poles will fill in the gaps in our measurements of the Sun’s magnetic field, which drives solar activity like flares and coronal mass ejections.The Sun is an active star, so it releases bursts of material and energy that can affect our astronauts and technology in space and even here on Earth — conditions collectively called space weather. SUGGESTED ANCHOR INTRO: A MISSION TO UNDERSTAND OUR CLOSEST STAR… THE SUN. THIS WEEKEND, NASA AND THE EUROPEAN SPACE AGENCY WILL LAUNCH A NEW MISSION TO THE SUN THAT WILL GIVE US HIGH RESOLUTION PHOTOS OF AREAS WE’VE NEVER SEEN BEFORE. HELPING US UNDERSTAND HOW THE SUN AFFECTS OUR LIVES HERE ON EARTH AND BEYOND...JOINING US NOW WE HAVE… LIVE FROM KENNEDY SPACE CENTER Schedule an InterviewTo schedule an interview, please fill out this form: https://forms.gle/g7znF7bz48CtmdNq7Scientists names will be updated next week. There will be a Spanish-speaking scientist available in addition to EnglishSatellite Coordinates** Interview Location: NASA’s Kennedy Space Center in Cape Canaveral, FL HD Satellite Coordinates for G17-K20/Upper: Galaxy 17 Ku-band Xp 20 Slot Upper| 91.0 ° W Longitude | DL 12109.0 MHz | Vertical Polarity | QPSK/DVB-S | FEC 3/4 | SR 13.235 Mbps | DR 18.2954 MHz | HD 720p | Format MPEG2 | Chroma Level 4:2:0 | Audio Embedded Suggested Questions1. NASA is launching a new mission to the Sun THIS WEEKEND! What is this mission going to be doing? 2. The mission will give us a look at the north and south poles for the very first time by flying in a very unusual orbit around the Sun. How difficult is it to get into this unique orbit? 3. The Sun has seasons, and we are currently in a season of low activity. How will this mission help us better understand these cycles? (Scientist will talk on solar weather and how it affects us) 4. Sunglasses won’t cut it for NASA’s next generation of astronauts. How will better understanding the Sun help astronauts go to the Moon and beyond with the Artemis mission? 5. Where can we learn more about the Solar Orbiter mission and get launch updates? Related pages
The Dynamic Solar Magnetic Field with Introduction
April 30th, 2018
Read moreThis narrated visualization transitions from a view of the Sun in visible light, to a view in ultraviolet light showing the plasma flowing along solar magnetic structures, to the underlying magnetic field of the solar photosphere, to a model construction of magnetic fieldlines above the photosphere.This video is also available on our YouTube channel. This visualization transitions from a view of the Sun in visible light, to a view in ultraviolet light showing the plasma flowing along solar magnetic structures, to the underlying magnetic field of the solar photosphere, to a model construction of magnetic fieldlines above the photosphere.Coming soon to our YouTube channel. A view of the Sun in visible light, showing a few sunspots. A view of the Sun in ultraviolet light at a wavelength of 171 Ångstroms. A photospheric magnetogram, showing regions of strong magnetic fields. The PFSS magnetic field model, one of the possible configurations for the magnetic field near the Sun based on the photospheric magnetogram. While the sun is well known as the overwhelming source of visible light in our solar system, a substantial part of its influence is driven by some aspects less visible to human perception - the magnetic field.In this visualization we start a view of the Sun in visible light (similiar to what you would see from the ground on Earth), to a view in extreme ultraviolet wavelengths (only visible to space-based instruments) which shows hot plasma streaming along magnetic field lines, to a magnetogram (derived from the visible light data) and finally to a three-dimensional magnetic field model built from that data. The sphere represents the solar photosphere, with neutral grey indicating a magnetic field of near zero intensity, black representing a magnetic field pointing INTO the sun (south or negative polarity) and white representing a magnetic field pointing OUT of the sun (north or positive polarity). We see that these magnetic regions often appear in nearby pairs of opposite polarities - which in visible light would often correspond to a pair of sunspots.Most of the solar photosphere has a magnetic field intensity of a few gauss while the active regions which form around sunspots can have magnetic fields of a few thousand gauss. Modern space-based instruments such as HMI (Helioseismic and Magnetic Imager) on the Solar Dynamics Observatory (SDO) enable us to measure the intensity of the magnetic field at the visible surface of the sun.Using this measured magnetic field on the photosphere, combined with mathematical models based on Maxwell's equations and plasma physics, we can construct how the magnetic field would look above the photosphere. Here, the white magnetic field lines are considered 'closed'. They move up, and then return to the solar surface. We often see these closed lines associated with pairs of active regions on the sun. The green and violet lines represent field lines that are considered 'open'. Green represents positive magnetic polarity, and violet represents negative polarity. These field lines do not connect back to the sun but with more distant magnetic fields in space.Here we build one of the simpler magnetic field models, called Potential Field Source Surface or PFSS, to construct how the magnetic 'lines of force' might look above the sun. The PFSS model represents the simplest and most steady magnetic field possible, though here we sample the field each day to illustrate the slow changes of the magnetic structure over time, in this case between January 1, 2011 through December 30, 2014.This camera view is fixed in Carrington Heliographic coordinates, so it moves with an 'average' solar rotation value with a period of 25.38 days. The solar equator moves faster than this, and high latitudes move slower. This makes active regions near the equator appear to move to the right (on average) while higher latitude regions move leftward.Some might note that this model looks rather different than an earlier version The Sun's Magnetic Field. In the earlier version, we were interested in the magnetic field structure significantly above the solar surface and so the model is examined favoring the field lines that reach high above the photosphere. In the model presented here, we are more interested in the magnetic field around the solar active regions, so we examine the model much closer to the photosphere, which favors magnetic field lines clustered around the active regions.An artifact in this visualization is a 'jump' of change that sweeps through the magnetic loops about once per month based on the timestamp in the lower left corner. This is an artifact of the fact that these types of magnetic field measurements can only be done on one side of the sun at a time. As the sun rotates, the features disappear over the limb and new ones appear on the opposite limb. While on the far-side of the sun from Earth, we have no direct measurements. However, we do have models that can simulate the slow changes in the field while not visible from Earth (described in the science paper Photospheric and heliospheric magnetic fields by Carolus J. Schrijver and Marc L. De Rosa). The 'jump' is created at the seam where the less accurate model gets overwritten by newer data. Related pages
Solar Orbiter's Orbit
Jan. 27th, 2020
Read moreAnimationCredit: ESA/ATG medialab An animation showing the trajectory of Solar Orbiter around the Sun, highlighting the gravity assist manoeuvres that will enable the spacecraft to change inclination to observe the Sun from different perspectives.During the initial cruise phase, which lasts until November 2021, Solar Orbiter will perform two gravity-assist manoeuvres around Venus and one around Earth to alter the spacecraft’s trajectory, guiding it towards the innermost regions of the Solar System. At the same time, Solar Orbiter will acquire in situ data and characterise and calibrate its remote-sensing instruments. The first close solar pass will take place in 2022 at around a third of Earth’s distance from the Sun.The spacecraft’s orbit has been chosen to be ‘in resonance’ with Venus, which means that it will return to the planet’s vicinity every few orbits and can again use the planet’s gravity to alter or tilt its orbit. Initially Solar Orbiter will be confined to the same plane as the planets, but each encounter of Venus will increase its orbital inclination. For example, after the 2025 Venus encounter it will make its first solar pass at 17º inclination, increasing to 33º during a proposed mission extension phase, bringing even more of the polar regions into direct view. Related pages
Solar Orbiter - NASA Animations
Jan. 27th, 2020
Read moreA conceptual animation of the Sun with no magnetic field lines. A conceptual animation of the Sun with magnetic field lines. Solar Orbiter orbiting the Sun. No field lines. Solar Orbiter orbiting the Sun. With field lines. Solar Orbiter orbiting the Sun. No field lines. Solar Orbiter orbiting the Sun. With field lines. Solar Orbiter is an international cooperative mission between the European Space Agency and NASA that addresses a central question of heliophysics: How does the Sun create and control the constantly changing space environment throughout the solar system? The Sun creates what’s known as the heliosphere — a giant bubble of charged particles and magnetic fields blown outward by the Sun that stretches more than twice the distance to Pluto at its nearest edge, enveloping every planet in our solar system and shaping the space around us. To understand it, Solar Orbiter will travel as close as 26 million miles from the Sun, inside the orbit of Mercury. There, it will measure the magnetic fields, waves, energetic particles and plasma escaping the Sun while they are in their pristine state, before being modified and mixed in their long journey from the Sun. Related pages
Solar Orbiter - ESA Animations
Dec. 11th, 2019
Read moreSpacecraft separation - GIF Visualization of the separation of Solar Orbiter from the Atlas V upper stage about 53 minutes after launch. Credit: ESA/ATG medialab Spacecraft separation - Video Visualization of the separation of Solar Orbiter from the Atlas V upper stage about 53 minutes after launch. Credit: ESA/ATG medialab Thrusters & Solar Array Deployment - GIF Visualization showing the thrusters adjust the attitude of the spacecraft before the solar arrays are deployed. The deployment happens in two stages: the first part takes place about five minutes after separation and is spring-driven, unfolding the solar arrays to about 40% within four minutes. The second part is motorised, and will fully extend the solar arrays. This part takes about ten minutes. The solar arrays will be fully deployed by about 40 minutes after spacecraft separation. Credit: ESA/ATG medialab Thrusters & Solar Array Deployment - Video Visualization showing the thrusters adjust the attitude of the spacecraft before the solar arrays are deployed. The deployment happens in two stages: the first part takes place about five minutes after separation and is spring-driven, unfolding the solar arrays to about 40% within four minutes. The second part is motorised, and will fully extend the solar arrays. This part takes about ten minutes. The solar arrays will be fully deployed by about 40 minutes after spacecraft separation. Credit: ESA/ATG medialab Boom / antenna deployments - GIFVisualization showing the deployment of various boom/antennas. In the beginning, the first Radio and Plasma Waves (RPW) antenna is deployed. Then the boom hosting a suite of scientific instruments is deployed (MAG, RPW, and SWA to measure the magnetic and electric fields, and solar wind around the spacecraft). Subsequently, the remaining two RPW antennas are deployed. Finally, the high gain antenna dish is unfurled. In reality this sequence is spaced out over a 24 hour period. Credit: ESA/ATG medialab Boom / antenna deployments - VideoVisualization showing the deployment of various boom/antennas. In the beginning, the first Radio and Plasma Waves (RPW) antenna is deployed. Then the boom hosting a suite of scientific instruments is deployed (MAG, RPW, and SWA to measure the magnetic and electric fields, and solar wind around the spacecraft). Subsequently, the remaining two RPW antennas are deployed. Finally, the high gain antenna dish is unfurled. In reality this sequence is spaced out over a 24 hour period. Credit: ESA/ATG medialab Venus Flyby - GIFVisualization of a Venus gravity flyby. Solar Orbiter will make numerous gravity assist flybys of Venus (and one of Earth) over the course of its mission to adjust its orbit, bringing it closer to the Sun and also out of the plane of the Solar System to observe the Sun from progressively higher inclinations. This will result in the spacecraft being able to take the first ever images of the Sun’s polar regions, crucial for understanding how the Sun ‘works’. Credit: ESA/ATG medialab Venus Flyby - VideoVisualization of a Venus gravity flyby. Solar Orbiter will make numerous gravity assist flybys of Venus (and one of Earth) over the course of its mission to adjust its orbit, bringing it closer to the Sun and also out of the plane of the Solar System to observe the Sun from progressively higher inclinations. This will result in the spacecraft being able to take the first ever images of the Sun’s polar regions, crucial for understanding how the Sun ‘works’. Credit: ESA/ATG medialab Facing the Sun Part 1 - GIFThis visualization begins by showing small sliding doors in the heatshield open to allow the internally-mounted remote-sensing instruments to observe the Sun. Special windows block out heat to protect the instruments during operations. The doors are closed when the instruments are not observing. Credit: ESA/ATG medialab Facing the Sun Part 1 - VideoThis visualization begins by showing small sliding doors in the heatshield open to allow the internally-mounted remote-sensing instruments to observe the Sun. Special windows block out heat to protect the instruments during operations. The doors are closed when the instruments are not observing. Credit: ESA/ATG medialab Facing the Sun Part 2 - GIFDuring its closest approaches of the Sun, Solar Orbiter will be travelling fast enough to study how magnetically active regions evolve for up to four weeks at a time. Credit: ESA/ATG medialab Facing the Sun Part 2- VideoDuring its closest approaches of the Sun, Solar Orbiter will be travelling fast enough to study how magnetically active regions evolve for up to four weeks at a time. Credit: ESA/ATG medialab A time-lapse of Solar Orbiter in a clean room. Credit: ESA/ATG medialab Visualization of the launch of Solar Orbiter on an Atlas V 411. Credit: ESA/ATG medialab Visualization of the Atlas V 411 fairing separation revealing Solar Orbiter attached to the rocket upper stage.Credit: ESA/ATG medialab Visualization of Solar Orbiter making an Earth flyby. The spacecraft will make one Earth flyby during the early stages of its mission, in November 2021. It will make numerous flybys of Venus to adjust its orbit, bringing it closer to the Sun and also out of the plane of the Solar System to observe the Sun from progressively higher inclinations. This will result in the spacecraft being able to take the first ever images of the Sun’s polar regions, crucial for understanding how the Sun ‘works’. Credit: ESA/ATG medialab Solar Orbiter is an European Space Agency (ESA) mission with strong NASA participation. Its mission is to perform unprecedented close-up observations of the Sun and from high-latitudes, providing the first images of the uncharted polar regions of the Sun, and investigating the Sun-Earth connection. Related pages
Parker Science Result animations
Dec. 4th, 2019
Read moreThe dynamic solar wind Observed near Earth, the solar wind is a relatively uniform flow of plasma, with occasional turbulent tumbles. But by that point it’s traveled over ninety million miles — and the signatures of the Sun's exact mechanisms for heating and accelerating the solar wind are wiped out. Closer to the solar wind's source, Parker Solar Probe saw a much different picture: a complicated, active system. Credit: NASA Goddard/CIL/Adriana Manrique Gutierrez Top-down view of Switchback Magnetic FieldsParker indicated that the solar magnetic field embedded in the solar wind flips in the direction. These reversals — dubbed "switchbacks" — last anywhere from a few seconds to several minutes as they flow over Parker Solar Probe. During a switchback, the magnetic field whips back on itself until it is pointed almost directly back at the Sun.Credit: NASA Goddard/CIL/Adriana Manrique Gutierrez Switchback CloseupParker indicated that the solar magnetic field embedded in the solar wind flips in the direction. These reversals — dubbed "switchbacks" — last anywhere from a few seconds to several minutes as they flow over Parker Solar Probe. During a switchback, the magnetic field whips back on itself until it is pointed almost directly back at the Sun. The spacecraft's approximate location is represented as a dot icon. Credit: NASA Goddard/CIL/Adriana Manrique Gutierrez Artist interreptation of flying by the Earth, Sun and the Heliopause. Credit: NASA Goddard/CIL/Jonathan North Solar Magnetic FieldExactly where the solar wind transitions from a rotational flow to a perfectly radial flow has implications for how the Sun sheds energy. Parker located a transition region in the solar wind's flow. Finding that point may help us better understand the lifecycle of other stars or the formation of protoplanetary disks, the dense disks of gas and dust around young stars that eventually coalesce into planets. The spacecraft's approximate location is represented as a dot icon.Credit: NASA Goddard/CIL/Jonathan North On Dec. 4, 2019, four new papers in the journal Nature describe what scientists working with data from NASA's Parker Solar Probe have learned from this unprecedented exploration of our star — and what they look forward to learning next. These findings reveal new information about the behavior of the material and particles that speed away from the Sun, bringing scientists closer to answering fundamental questions about the physics of our star. These animations represent five of those findings. Related pages
Parker Solar Probe Science Briefing - Visual Resources
July 20th, 2018
Read moreTrailer without text introduction. Music credit: Luminous Skies [Underscore] by Andrew Prahlow from www.killertracks.comComplete transcript available.Watch this video on the NASA Goddard YouTube channel. Image of Parker Solar Probe. Credit: APL/NASA GSFC Beauty pass animation of Parker Solar Probe in the solar wind. Credit: NASA GSFC/CIL/Brian Monroe Animation of the solar wind. Credit: NASA GSFC/CIL/Krystofer Kim Photo of Eugene Parker. Credit: University of Chicago Animation of a coronal mass ejection (CME) from the Sun. Credit: NASA GSFC/CIL/Krystofer Kim Animation of a spacecraft being damaged by space weather. Credit: NASA GSFC/CIL/Krystofer Kim Graphic illustrating the layers of the Sun. Credit: NASA GSFC/Mary Pat Hrybyk-Keith Animation of Parker Solar Probe during a Venus flyby. Credit: Johns Hopkins University/APL/Steve Gribben Animation of Parker Solar Probe's trajectory. Credit: Johns Hopkins University/APL/Steve Gribben Animation of Parker Solar Probe approaching the Sun. Credit: Johns Hopkins University/APL/Steve Gribben Graphic identifying the solar limb sensors on Parker Solar Probe. The sensors help the spacecraft stay oriented behind its protective shield. Credit: NASA/APL Engineer Patrick Hill (Johns Hopkins APL) gives a tour of the Parker Solar Probes's systems. Credit: NASA/Johns Hopkins APL/Lee HobsonComplete transcript available. July 20, 2018 - Live from NASA Kennedy - 1:00 p.m. ESTHosted by Karen Fox - Heliophysics Communications Lead, NASA Goddard/NASA HQSpeakers:Nicola Fox - Parker Solar Probe Project Scientist, The Johns Hopkins University Applied Physics LabAlex Young - Solar Scientist from NASA GoddardThomas Zurbuchen - Associate Administrator for the Science Mission Directorate at NASABetsy Congdon - Thermal Protection System Engineer at The Johns Hopkins University Applied Physics Lab Related pages
Snapshots from the Edge of the Sun
Sept. 1st, 2016
Read moreGIF of animated sun with corona and solar wind labels. Narrated video about discovering the boundary between the corona - the sun's outermost layer - and solar wind - the continuous stream of particles eminating from the sun.Music credit: Shopping with Momma by Rik Pfenninger 1 minute version of the video without narration.Music credit: Shopping with Momma by Rik Pfenninger. 30 second version of the video without narration. Music credit: Shopping with Momma by Rik Pfenninger GIF showing the before (left) and after (right) video of the solar wind, as seen by NASA's STEREO spacecraft. Scientists used an algorithm to dim the appearance of bright stars and dust in images of the faint solar wind. This innovation enabled them to see the transition from the corona to the solar wind. It also gives us the first video of the solar wind itself in a previously unmapped region. GIF excerpt from processed STEREO data of the solar wind. Data credit: Craig DeForest, SwRI GIF of animated sun's magnetic field, corona, and solar wind. Scientists think that the sun's magnetic control over its material becomes weaker the farther out it goes. This creates a break in the material's consistency, marking the transition from the corona to the solar wind. GIF of animated sun's magnetic field, corona, and solar wind. Scientists think that the sun's magnetic control over its material becomes weaker the farther out it goes. This creates a break in the material's consistency, marking the transition from the corona to the solar wind. For the first time, using NASA’s Solar Terrestrial Relations Observatory, or STEREO, scientists have imaged the edge of the sun and described that transition – from which the solar wind blows. Defining the details of this boundary helps us learn more about our solar neighborhood, which is bathed throughout by solar material – a space environment that we must understand to safely explore beyond our planet. A paper on the findings was published in The Astrophysical Journal on Sept. 1, 2016. Related pages
SDO: Year 5
Feb. 11th, 2015
Read moreHighlights from the Solar Dynamics Observatory's five years of watching the sun.The music is "Expanding Universe" and "Facing the Unknown" both from Killer Tracks.Watch this video on the NASA Goddard YouTube channel.For complete transcript, click here.Information about the individual clips used in this video is here.Credit: NASA's Goddard Space Flight Center/SDO Large square version of the SDO 5 Year mosaic.Credit: NASA's Goddard Space Flight Center/SDO February 11, 2015 marks five years in space for NASA's Solar Dynamics Observatory, which provides incredibly detailed images of the whole sun 24 hours a day. Capturing an image more than once per second, SDO has provided an unprecedentedly clear picture of how massive explosions on the sun grow and erupt ever since its launch on Feb. 11, 2010. The imagery is also captivating, allowing one to watch the constant ballet of solar material through the sun's atmosphere, the corona. In honor of SDO's fifth anniversary, NASA has released a video showcasing highlights from the last five years of sun watching. Watch the movie to see giant clouds of solar material hurled out into space, the dance of giant loops hovering in the corona, and huge sunspots growing and shrinking on the sun's surface. The imagery is an example of the kind of data that SDO provides to scientists. By watching the sun in different wavelengths – and therefore different temperatures – scientists can watch how material courses through the corona, which holds clues to what causes eruptions on the sun, what heats the sun's atmosphere up to 1,000 times hotter than its surface, and why the sun's magnetic fields are constantly on the move.Five years into its mission, SDO continues to send back tantalizing imagery to incite scientists' curiosity. For example, in late 2014, SDO captured imagery of the largest sun spots seen since 1995 as well as a torrent of intense solar flares. Solar flares are bursts of light, energy and X-rays. They can occur by themselves or can be accompanied by what's called a coronal mass ejection, or CME, in which a giant cloud of solar material erupts off the sun, achieves escape velocity and heads off into space. In this case, the sun produced only flares and no CMEs, which, while not unheard of, is somewhat unusual for flares of that size. Scientists are looking at that data now to see if they can determine what circumstances might have led to flares eruptions alone. Goddard built, operates and manages the SDO spacecraft for NASA's Science Mission Directorate in Washington, D.C. SDO is the first mission of NASA's Living with a Star Program. The program's goal is to develop the scientific understanding necessary to address those aspects of the sun-Earth system that directly affect our lives and society. For More InformationSee [http://www.nasa.gov/content/goddard/videos-highlight-sdos-fifth-anniversary/](http://www.nasa.gov/content/goddard/videos-highlight-sdos-fifth-anniversary/) Related pages
The Sun's Magnetic Field
Dec. 5th, 2013
Read moreEvolution of the solar magnetic field from 1997 to 2013. Version with time-stamp written in the image file. Frames of the magnetic field movie. Instead of sequential frame numbers, the file name is tagged by year, month, and day: YYYYMMDD. During the course of the approximately 11 year sunspot cycle, the magnetic field of the Sun reverses. The last time this happened was around the year 2000. Using magnetograms from the SOHO/MDI and SDO/HMI instruments, it is possible to examine possible configurations of the magnetic field above the photosphere. These magnetic configurations are important in understanding potential conditions of severe space weather.The magnetic field in this animation is constructed using the Potential Field Source Surface (PFSS) model. The PFSS model is one of the simplest yet realistic models we can explore. Using the solar magnetograms as the 'source surface' of the field, it builds the field structure from the photosphere out to about two solar radii (an altitude of 1 solar radius). These visuals were generated using the SolarSoft package. In this visualization, the white magnetic field lines are considered 'closed'. The move up, and then return to the solar surface. The green and violet lines represenent field lines that are considered 'open'. Green represents positive magnetic polarity, and violet represents negative polarity. These field lines do not connect back to the Sun but with more distant magnetic fields in space. These field lines act as easy 'roads' for the high-speed solar wind. Related pages
Sun Magnetic Field Flip Live Shots and Media Resources
Dec. 5th, 2013
Read moreAlex Young is interviewed about the current solar cycle and what a magnetic flip means for the earth and NASA's study of magnetic fields. Watch this video on the NASA Goddard YouTube channel.This visualization shows the position of the sun's magnetic fields from January 1997 to December 2013. The field lines swarm with activity: The magenta lines show where the sun's overall field is negative and the green lines show where it is positive. Additional gray lines represent areas of local magnetic variation. The entire sun's magnetic polarity, flips approximately every 11 years – though sometimes it takes quite a bit longer – and defines what's known as the solar cycle. The visualization shows how in 1997, the sun shows the positive polarity on the top, and the negative polarity on the bottom. Over the next 16 years, each set of lines is seen to creep toward the opposite pole. By the end of the movie, the flip is almost complete. At the height of each magnetic flip, the sun goes through periods of more solar activity, during which there are more sunspots, and more eruptive events such as solar flares and coronal mass ejections, or CMEs. The point in time with the most sunspots is called solar maximum. Image showing the sun's magnetic fields on Jan. 1, 1997, June 1, 2003, and Dec. 1, 2013. Green indicates postive polarity. Purple is negative. Image shows magnetic fields radiating from the sun's poles. Image shows the magnetic fields of the sun have flipped from the previous image. The blue lines are now at top of the sun and red at the bottom. On Dec. 6, 2013, NASA scientists Alex Young and Holly Gilbert discussed how the sun's magnetic field is in the process of flipping. For More InformationSee [www.nasa.gov/sunearth](www.nasa.gov/sunearth) Related pages
Coronal Mass Ejections (CMEs) Blast Their Way Through the Solar System
Oct. 18th, 2011
Read moreAnimation with no labels. Animation with Labels. Labels with Alpha Channel. A coronal mass ejection erupts from the Sun and propagates out through the Solar System. Along the way it is detected by the spacecraft at Jupiter and Saturn. Eventually it is detected by the two Voyager spacecraft beyond the orbit of Pluto. This animation is based on CMEs produced during the Halloween storms of 2003. It is an update to a previous animation. Related pages